Tracking event performance allows you to monitor how well your events are performing and how members are engaging with them. From the dashboard, you can quickly see booking levels, available spots, and overall participation.
You can analyze performance at three levels: from the calendar overview to monitor multiple events at once, from the Booking tab to check detailed participation numbers for a specific event, and from the Analytics tab to understand member engagement and booking conversion.
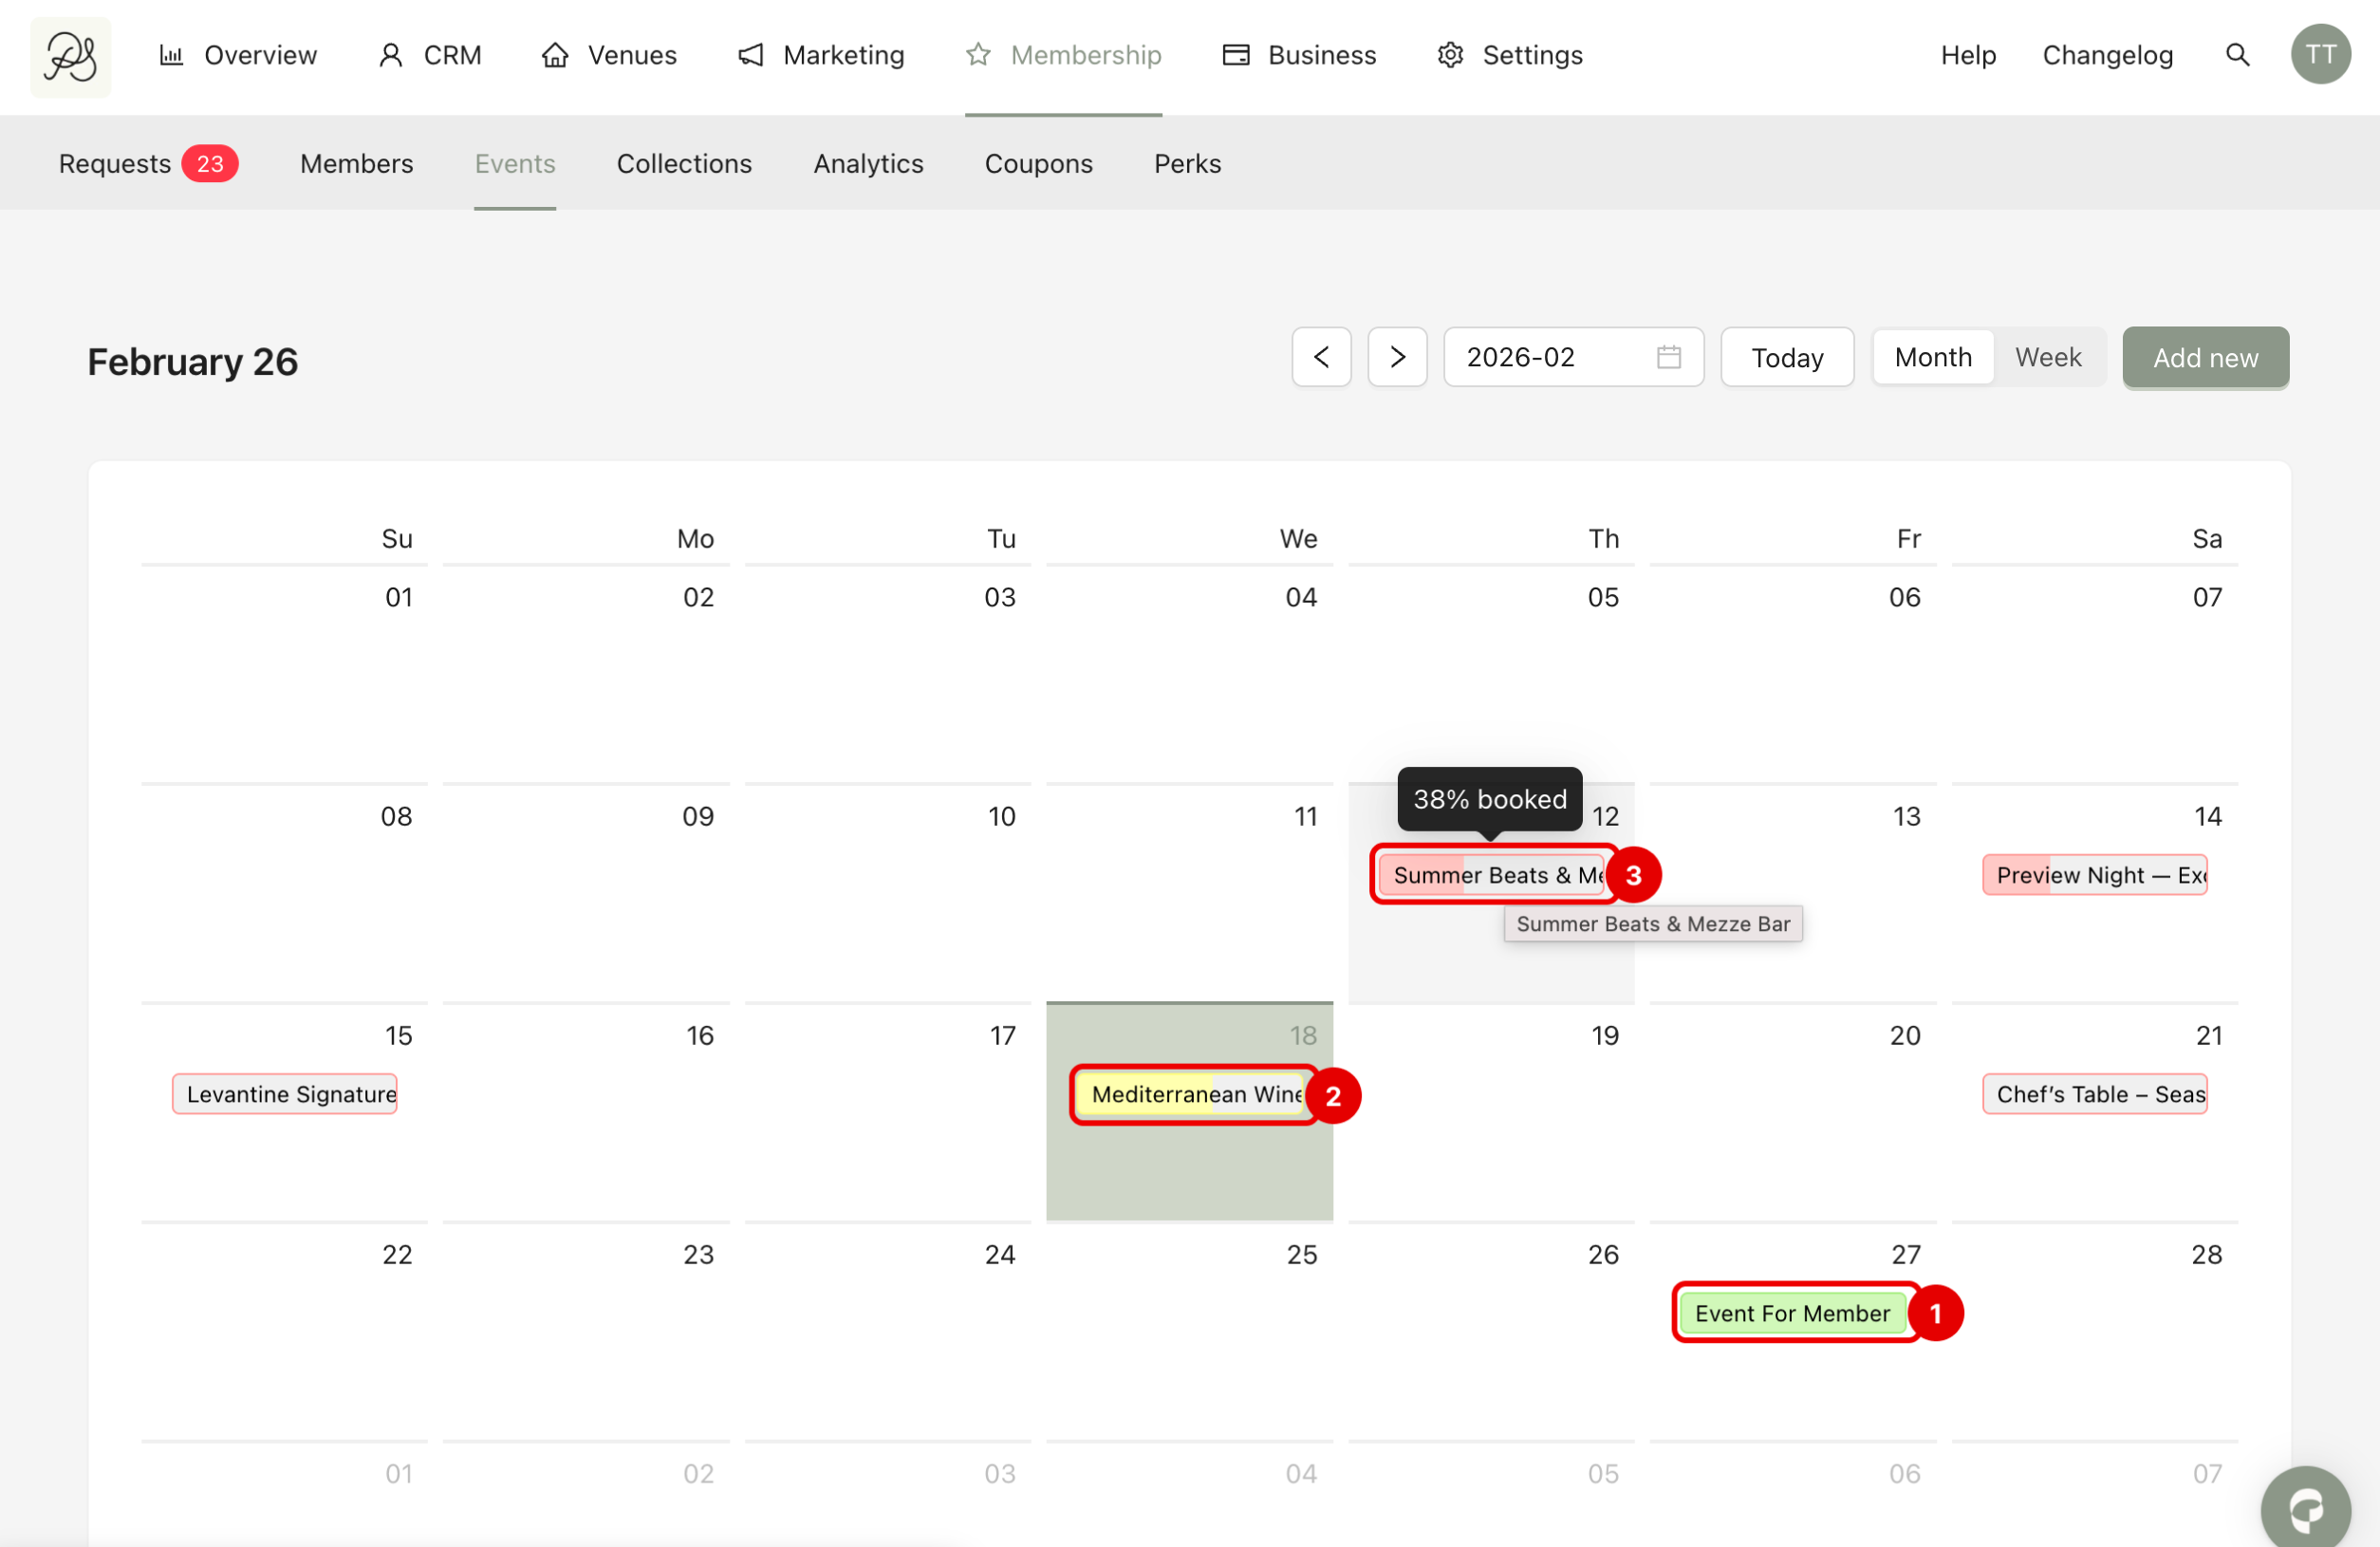
To access the overview, go to Membership → Events. You will see a calendar displaying all your events at their scheduled dates.
Each event is shown directly inside the date cell. Each event card uses booking progress and color indicators to represent its booking level:
Green (1) means the event is full or almost full.
Yellow (2) means the event has an average booking level.
Red (3) means the event still has many available spots.
When you hover over an event, you can see the booking percentage (for example, 100% booked).
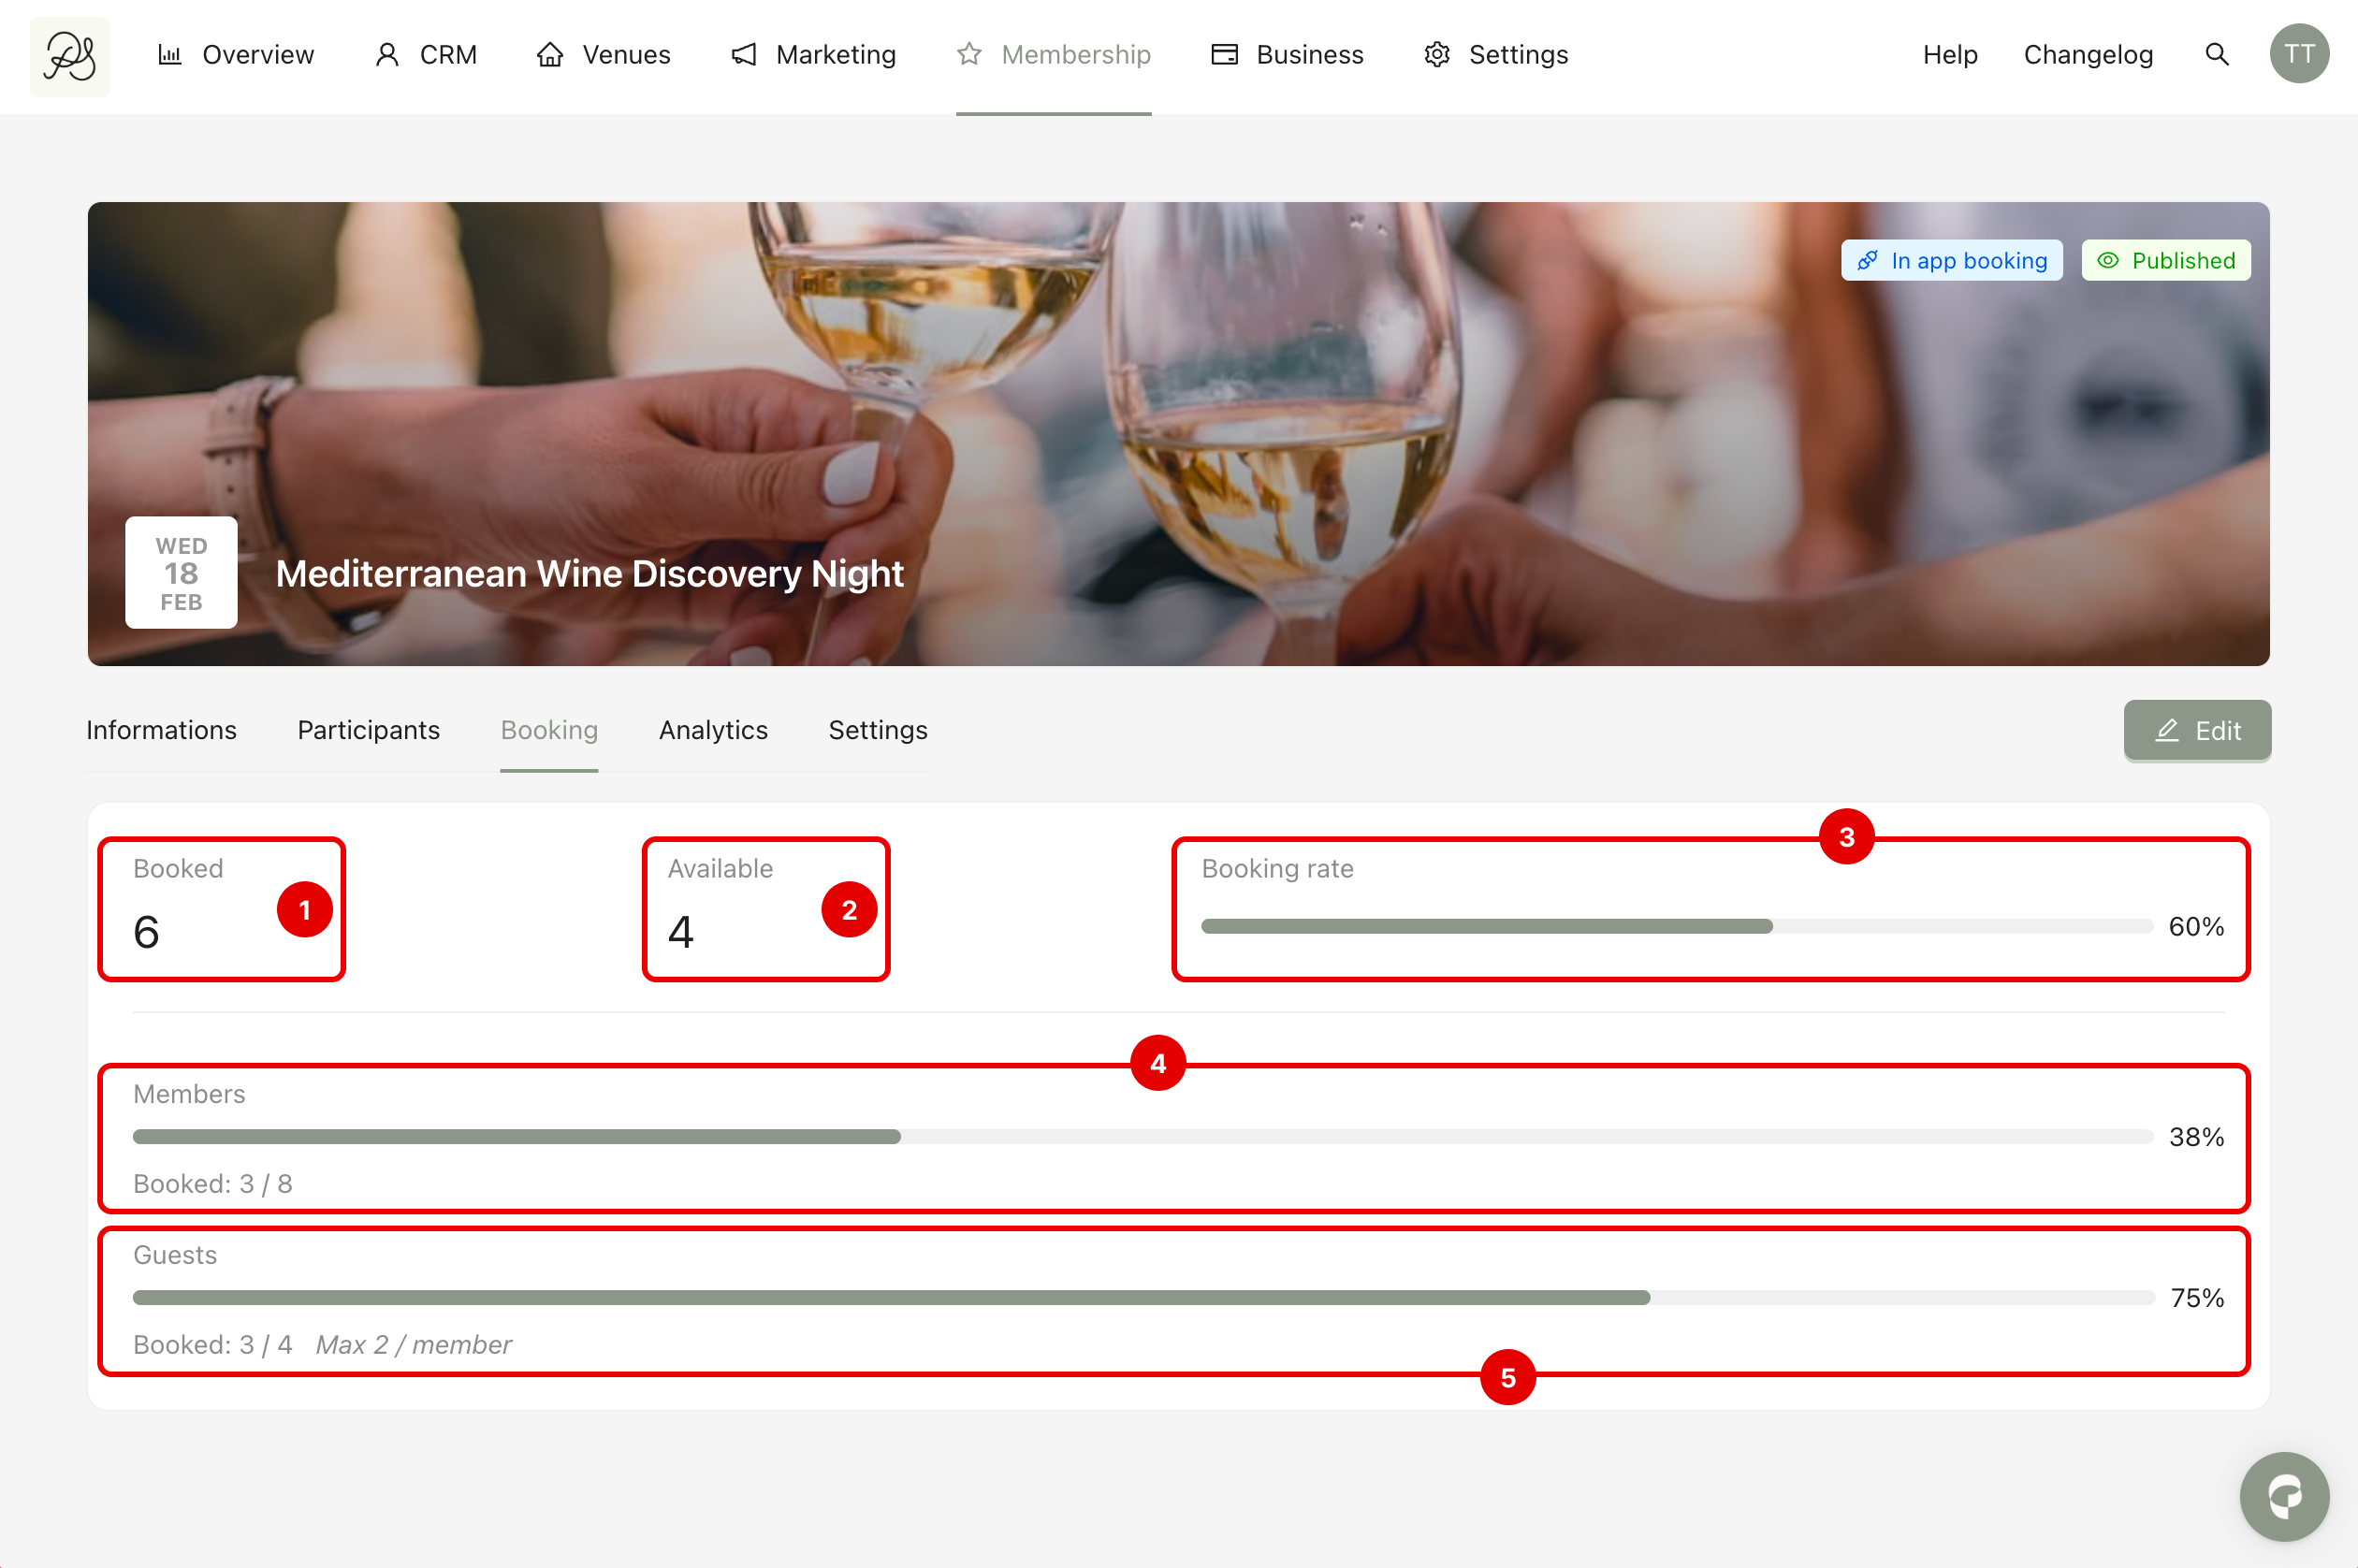
To see detailed booking information, click on a specific event from the calendar. Then go to the Booking tab.
This section shows real-time booking statistics.
Booked (1): The number of confirmed participants currently registered for the event.
Available (2): The number of remaining spots.
Booking Rate (3): A percentage showing how full the event is. For example, 60% means 60% of total capacity is filled.
Members (4): Shows how many members have booked compared to the maximum allowed.
Guests (5): Shows how many guest spots have been used.
To access performance analytics, open the event and go to the Analytics tab. This section focuses on engagement and conversion data.
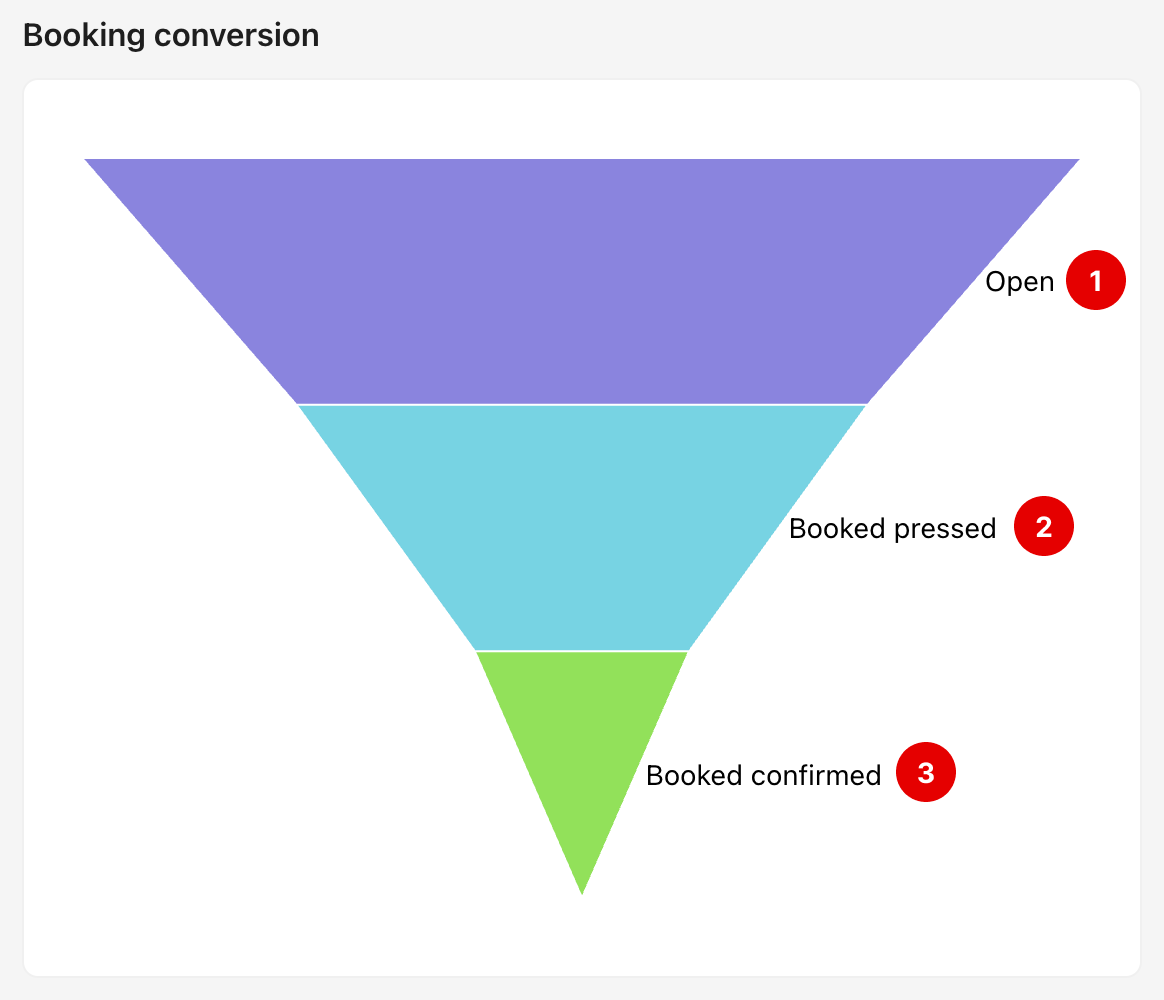
1. Booking Conversion
This funnel shows how members move through the booking process. The main stages are:
Open: Number of members who opened the event page in the app.
Booked Pressed: Number of members who clicked the booking button.
Booked Confirmed: Number of members who clicked confirm the booking in the tunnel.
This funnel helps you understand whether members are interested in the event. For example, if many members open the event but few confirm bookings, you may need to improve the event description, price, or timing.
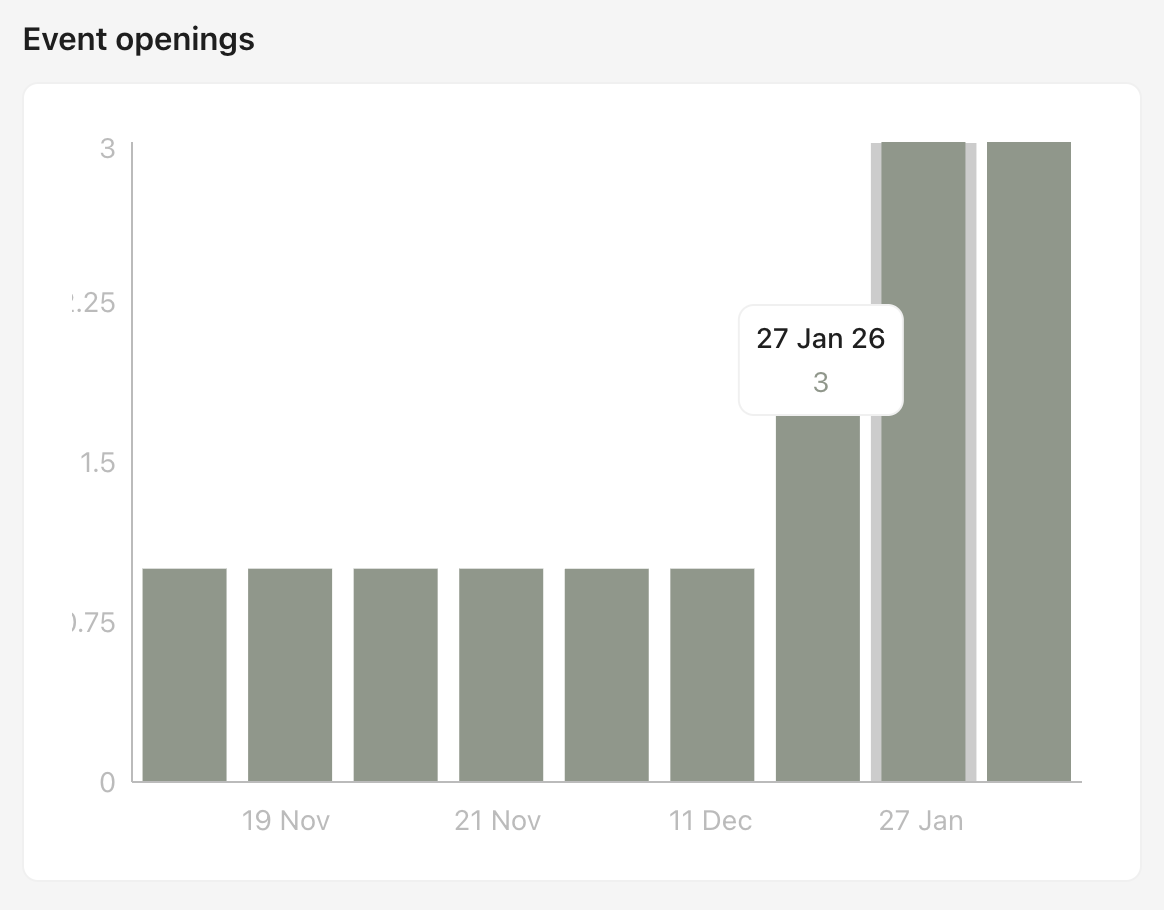
2. Event Openings
This chart shows how many times the event page was opened over time.
If you notice a spike in openings after sending a newsletter or push notification, it means your communication was effective.