Venue analytics provide insights into user behavior, booking performance, and revenue, helping you better understand how a venue performs within the mobile application.
The following roles are allowed to access venue analytics:
Admin
Head of Project
Marketing
Communication
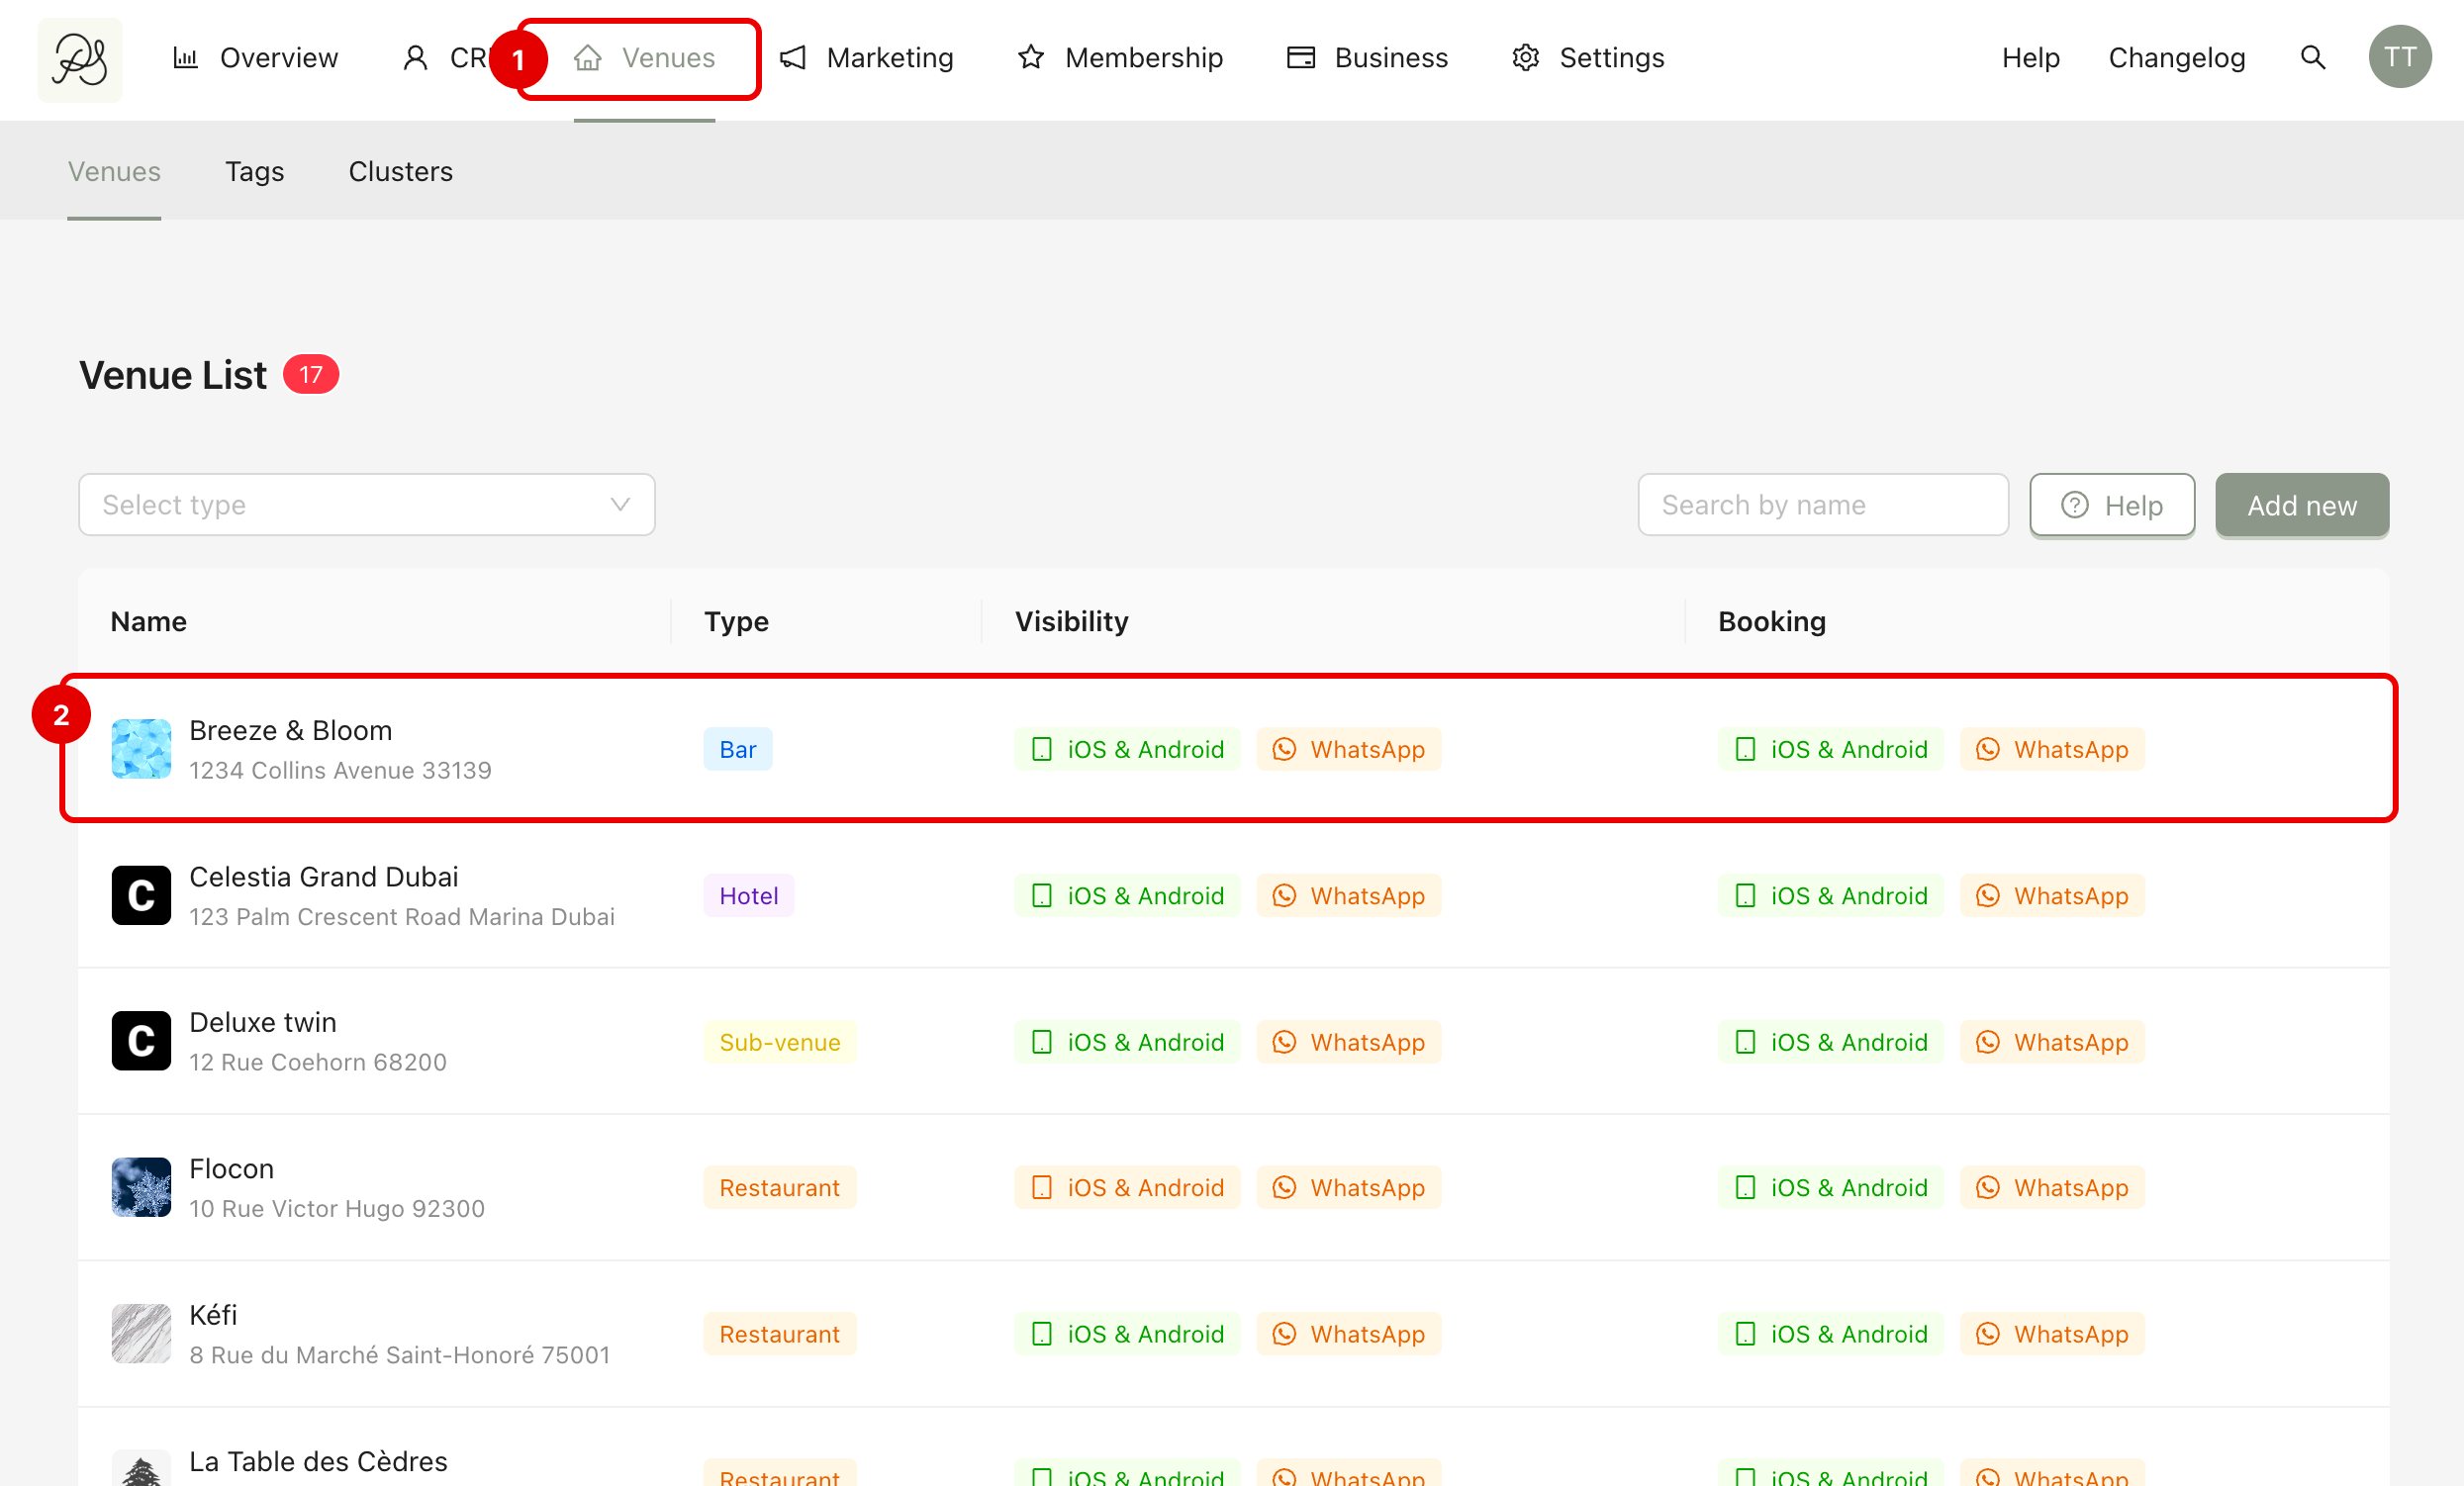
From the homepage, click Venues (1). Click on the venue you want to analyze (2).
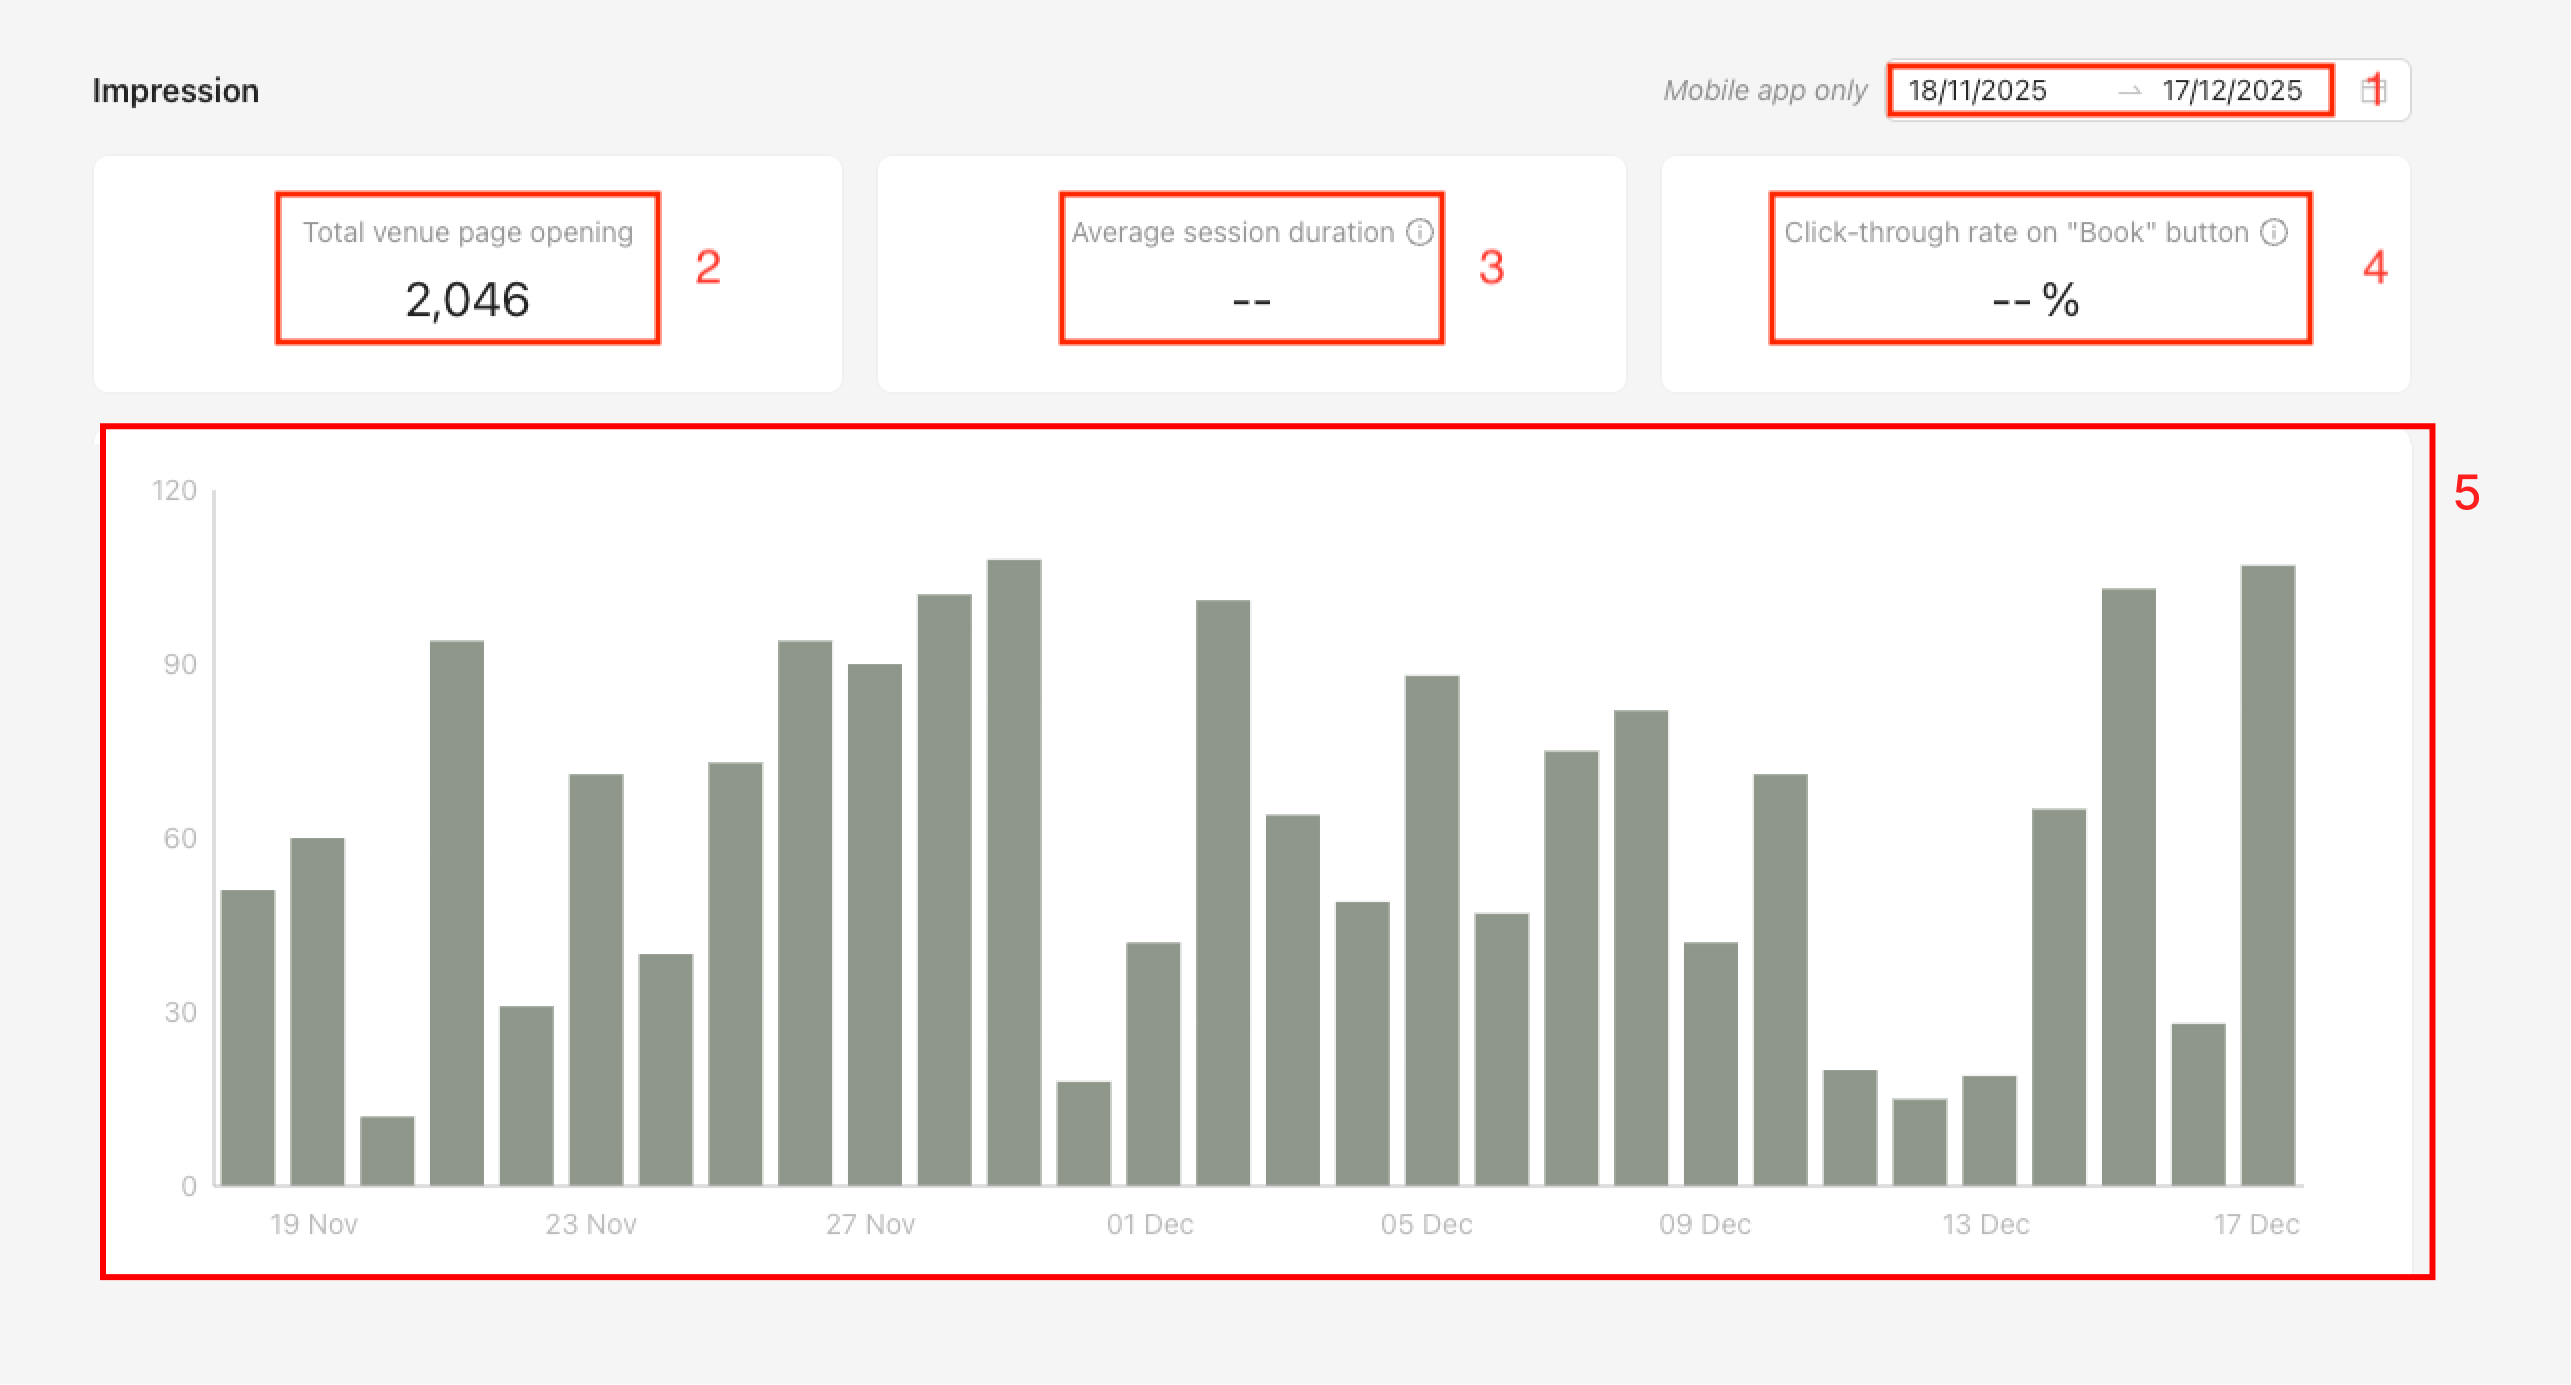
Here, you will see all the statistics of your venue. You can modify the time you want to view at the top right corner (1). The 3 types of statistics are:
(2) Total venue page opening: The number of times the venue detail page was opened in the mobile application.
(3) Averafe session duration: The average time spent on the venue detail page between opening and closing it.
(4) Click-through rate on “Book” button: The percentage of impressions that led to a click on the Book button.
(5) This chart allows you to see the daily number of openings of the venue detail page in the mobile application. When hovering over a bar in the chart, you can view the exact number of openings for that day.
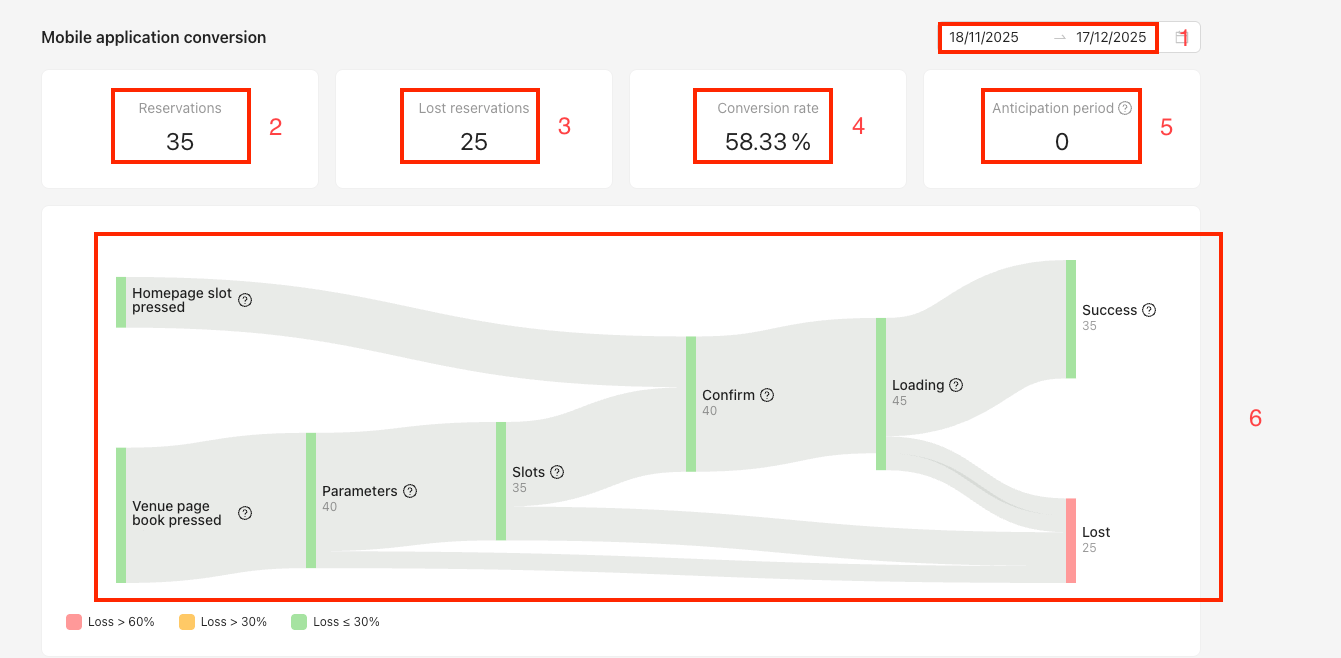
(2) Reservations: The total number of bookings completed.
(3) Lost reservations: The number of users who abandoned a booking after clicking on a slot on the Homepage or pressing the Book button on the venue detail page.
(4) Conversion rate: The percentage of bookings converted after the booking flow has started.
(5) Anticipation period: The average time between booking creation and the booking date.
A funnel chart showing how many users drop off at each step before completing a booking.
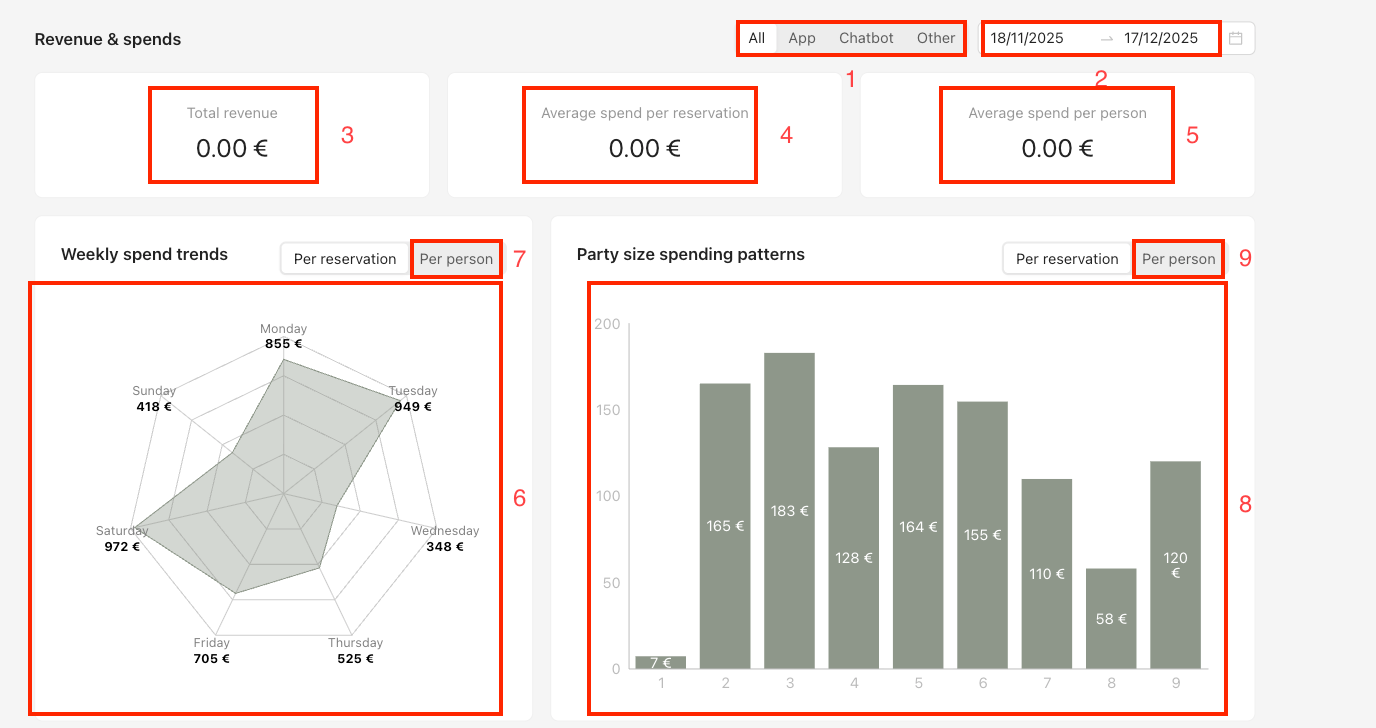
(1) In this section, you can select the product for which you want to view revenue.
(3) Total revenue: The total revenue amount.
(4) Average spend per reservation: The average amount you receive per booking.
(5) Average spend per person: The average amount you receive per user.
(6) Weekly spend trends: This chart shows the average amount spent per booking for each day of the week. If you click Per person (7), the same chart is displayed but calculated per person instead of per booking.
(8) Party size spending patterns: This chart shows the average amount spent based on the number of guests per booking. If you click Per person (9), the same chart is displayed but calculated per person instead of per booking.