These dashboards provide insights into user activity, engagement, conversion, and revenue.
To access the page, click Overview. You will see the main metrics here.
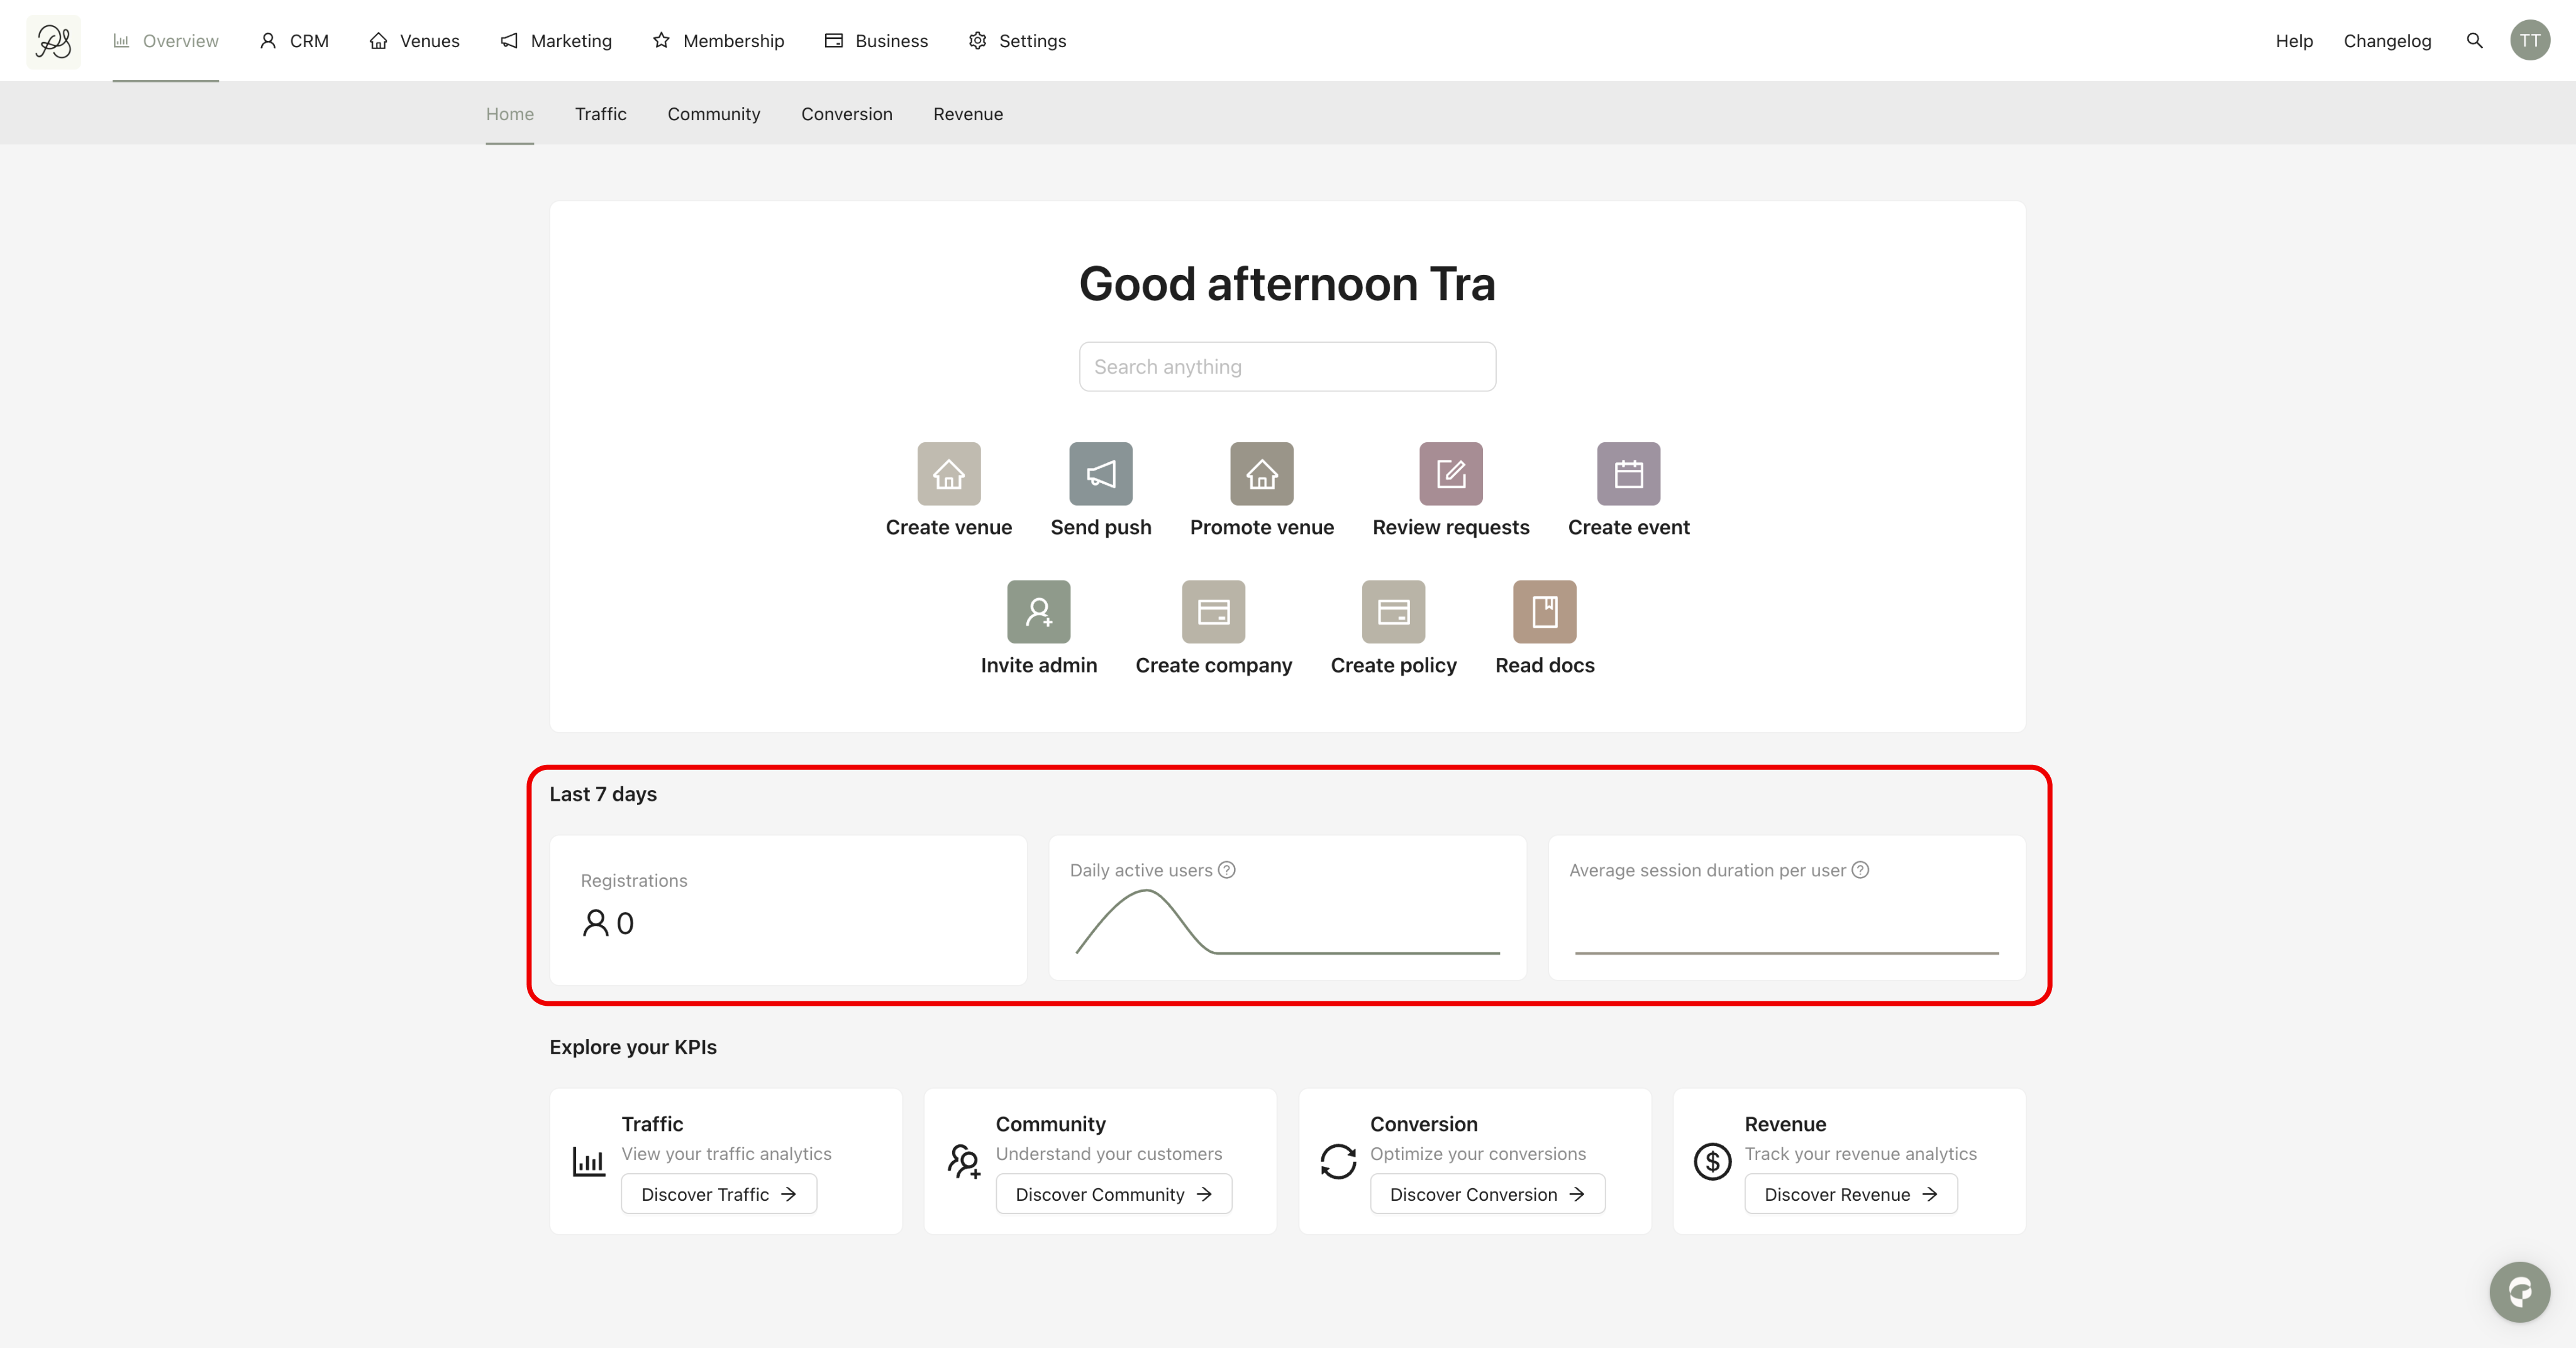
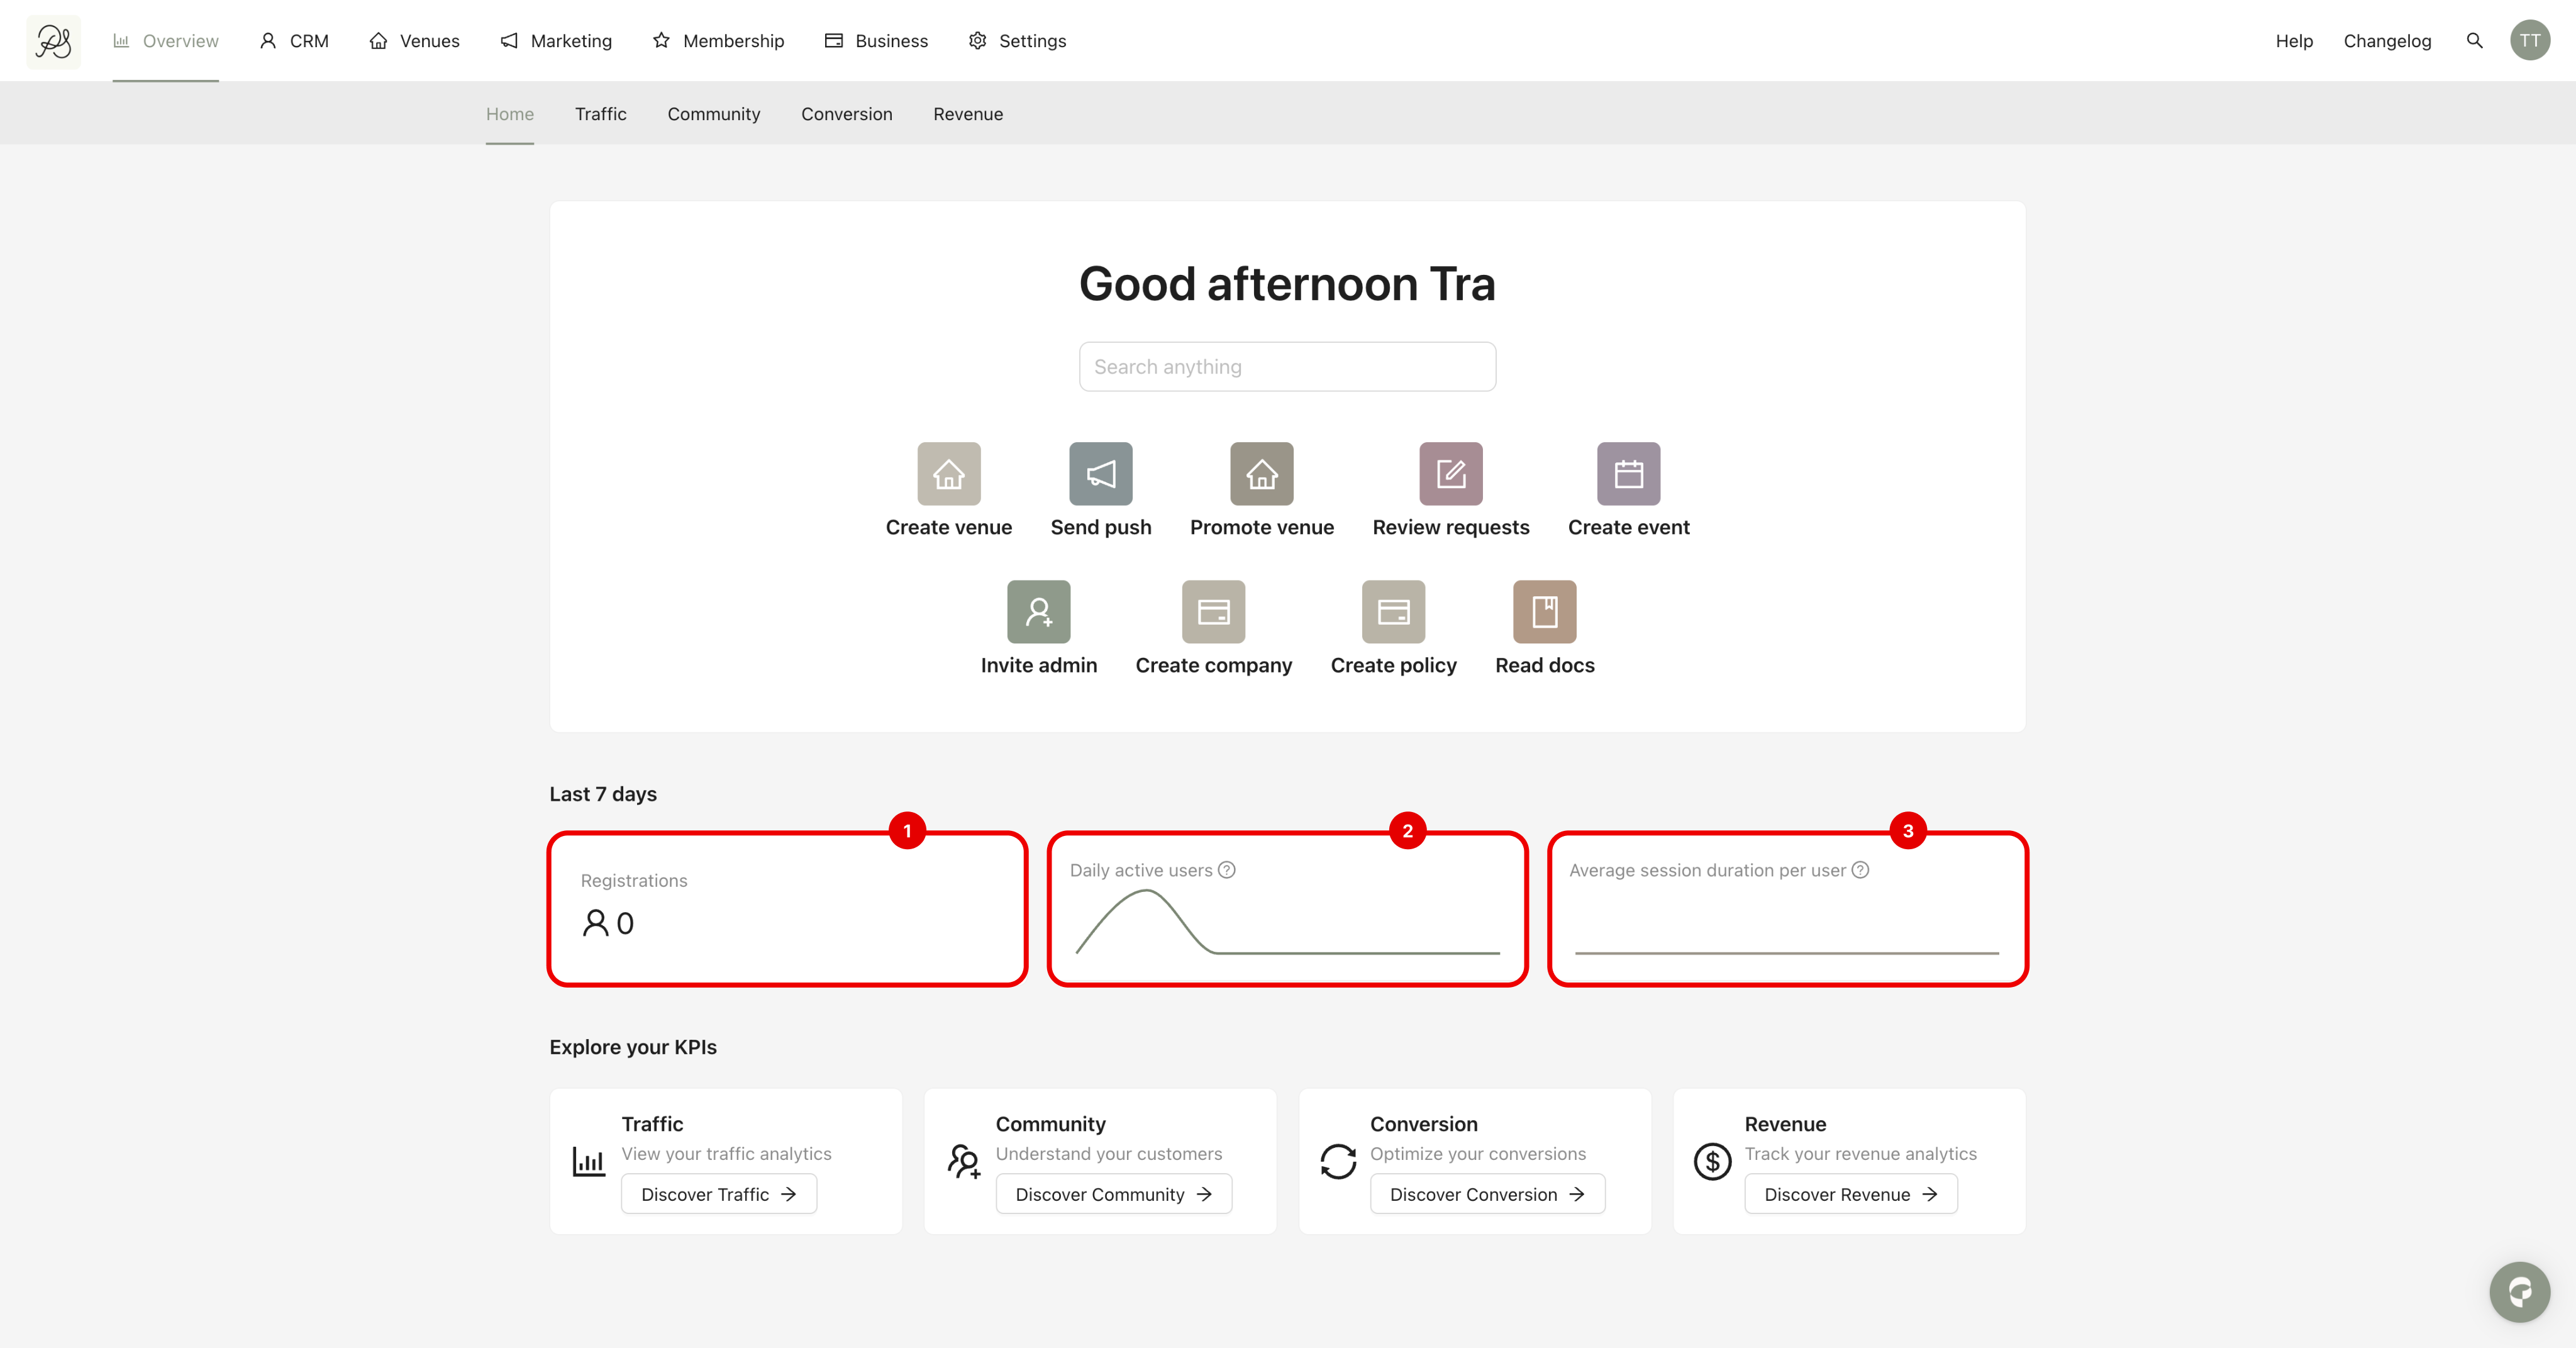
You can see 3 main metrics:
(1) Registration: Displays the number of new users registered in the Pléthore database over the last 7 days.
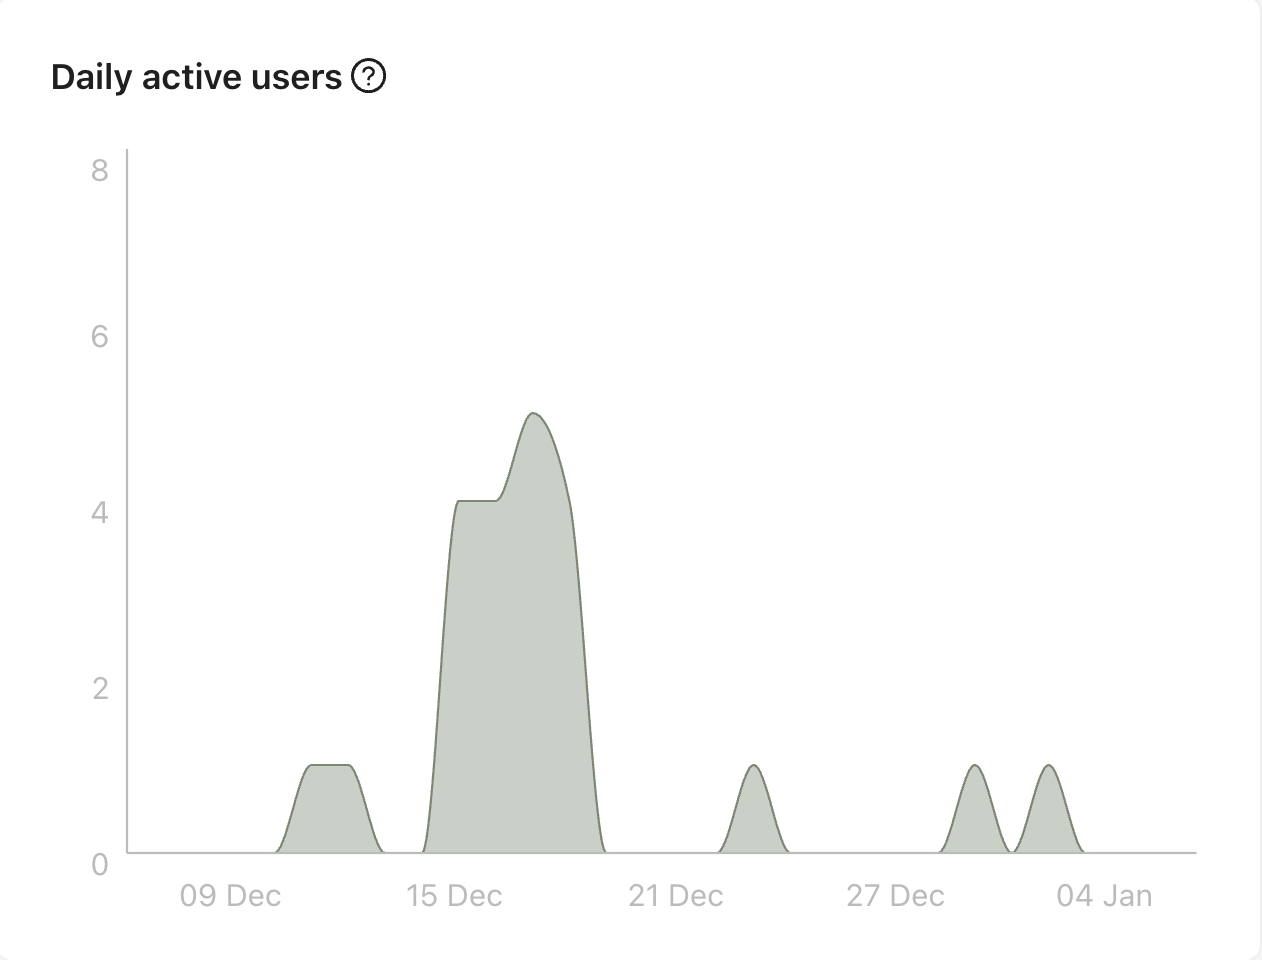
(2) Daily active user: Shows the daily evolution of unique active users over the last 7 days.
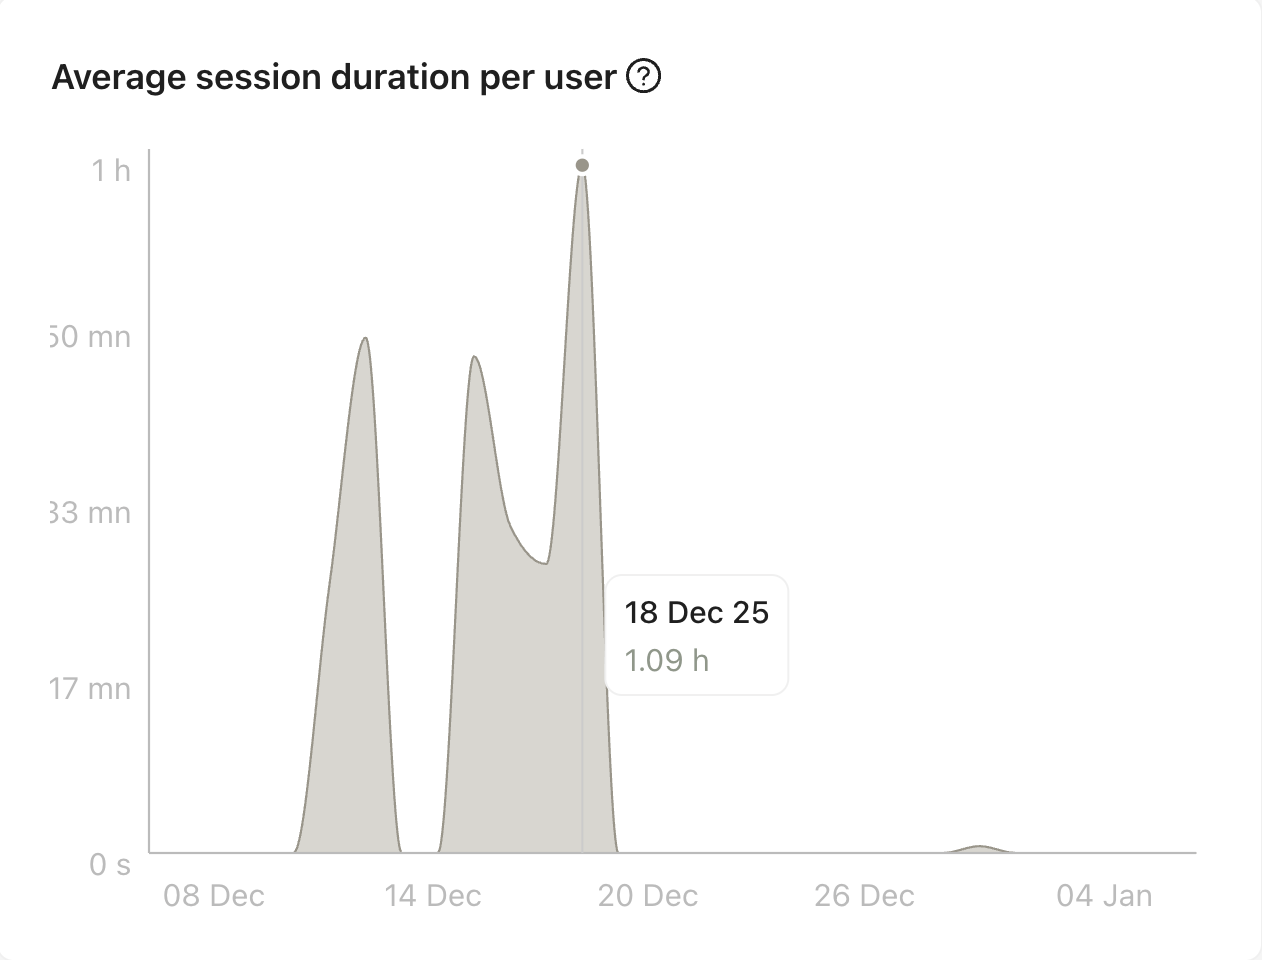
(3) Average session duration per user: Displays the average session duration per user per day over the last 7 days.
To access the page, click the tab Traffic in the page Overview. You can see all your mobile application traffics here:
2.1. Daily active user: This chart shows the number of active users per day.
2.2. Average session duration per user: This chart shows the average time spent by users in the mobile application each day.
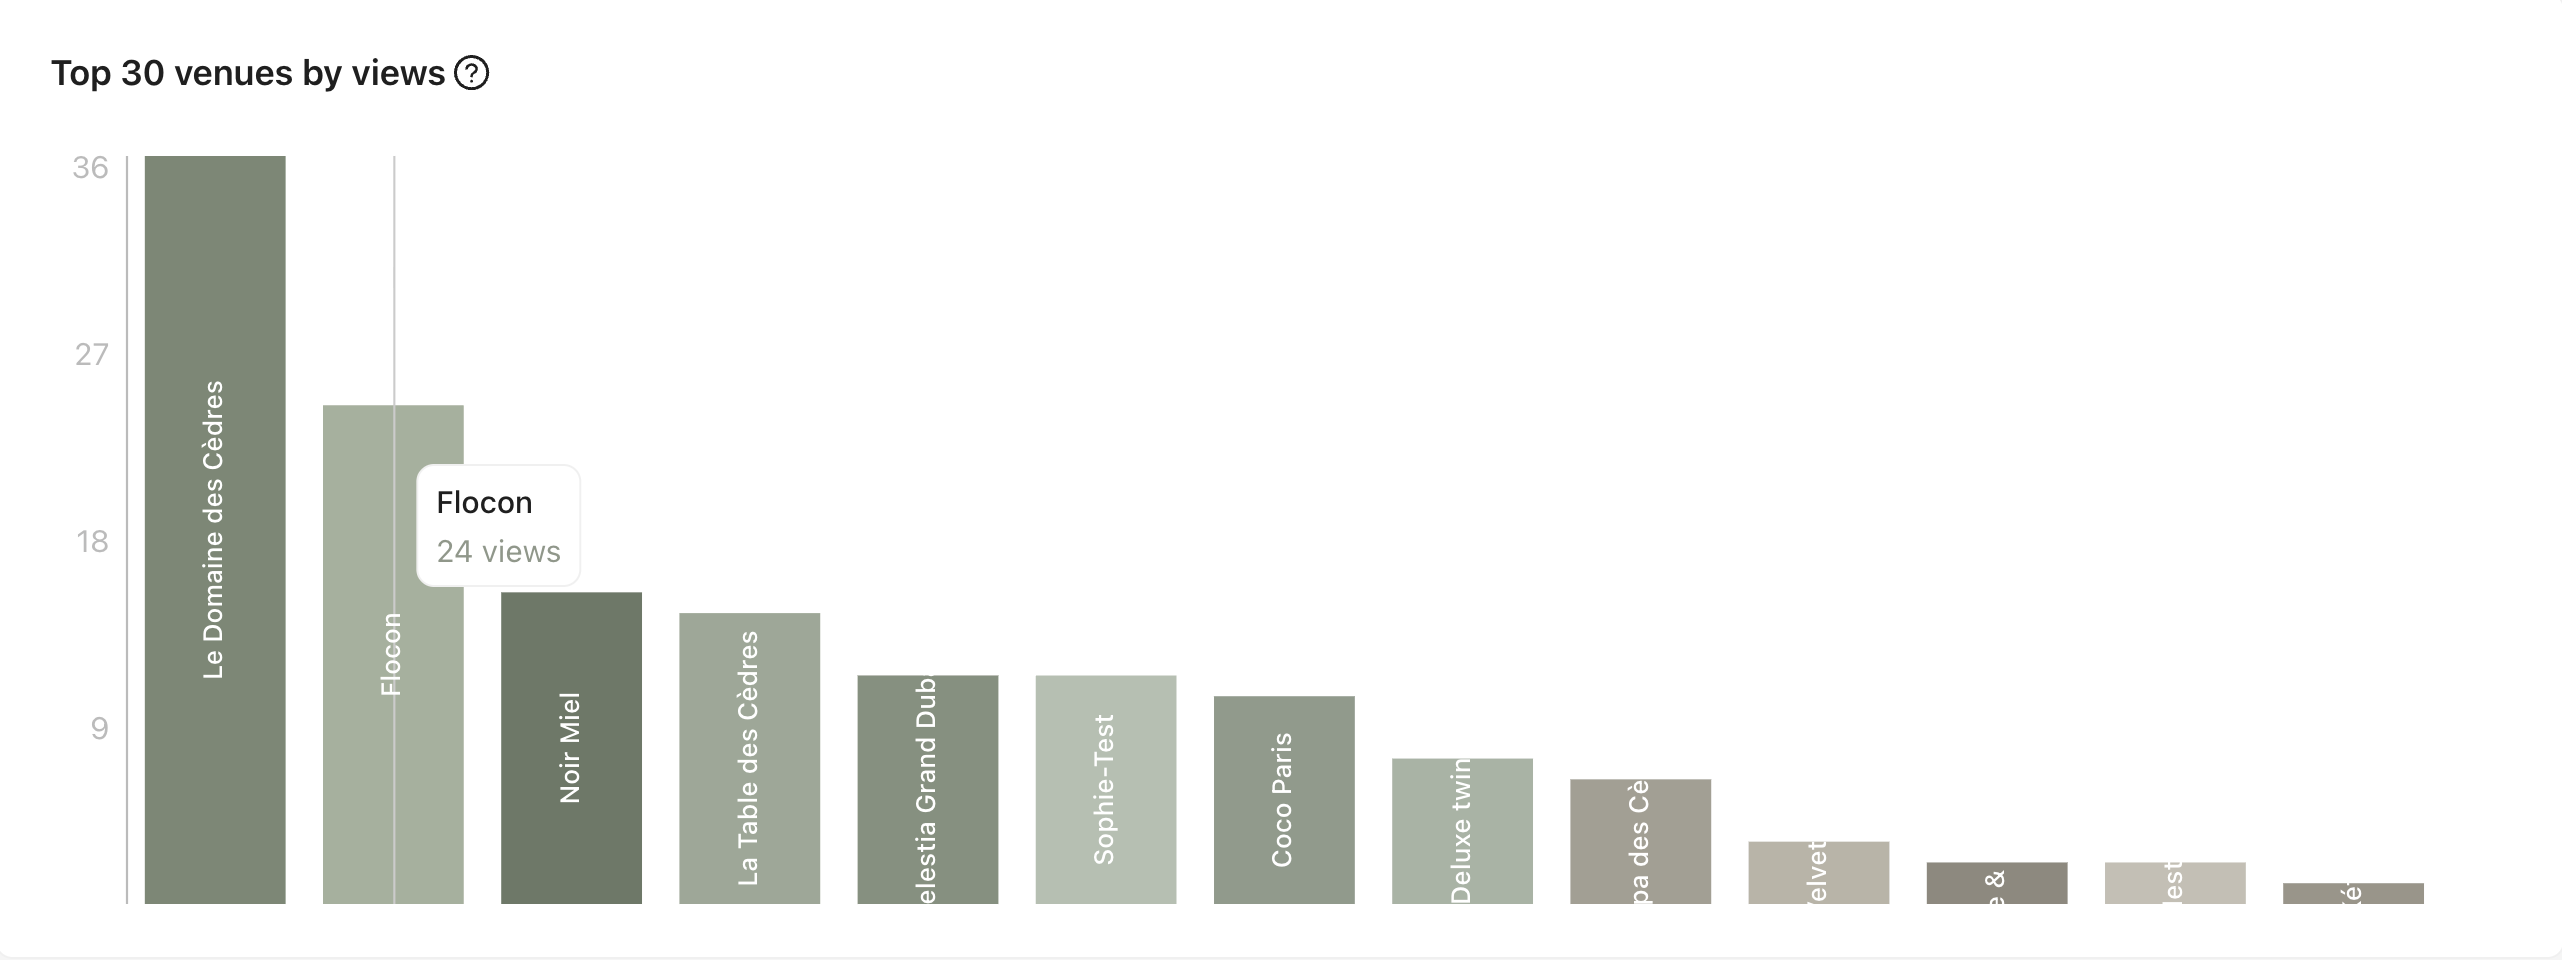
2.3. Top 30 venues by views: Top 30 venues with the most visits to their detail pages in the mobile app.
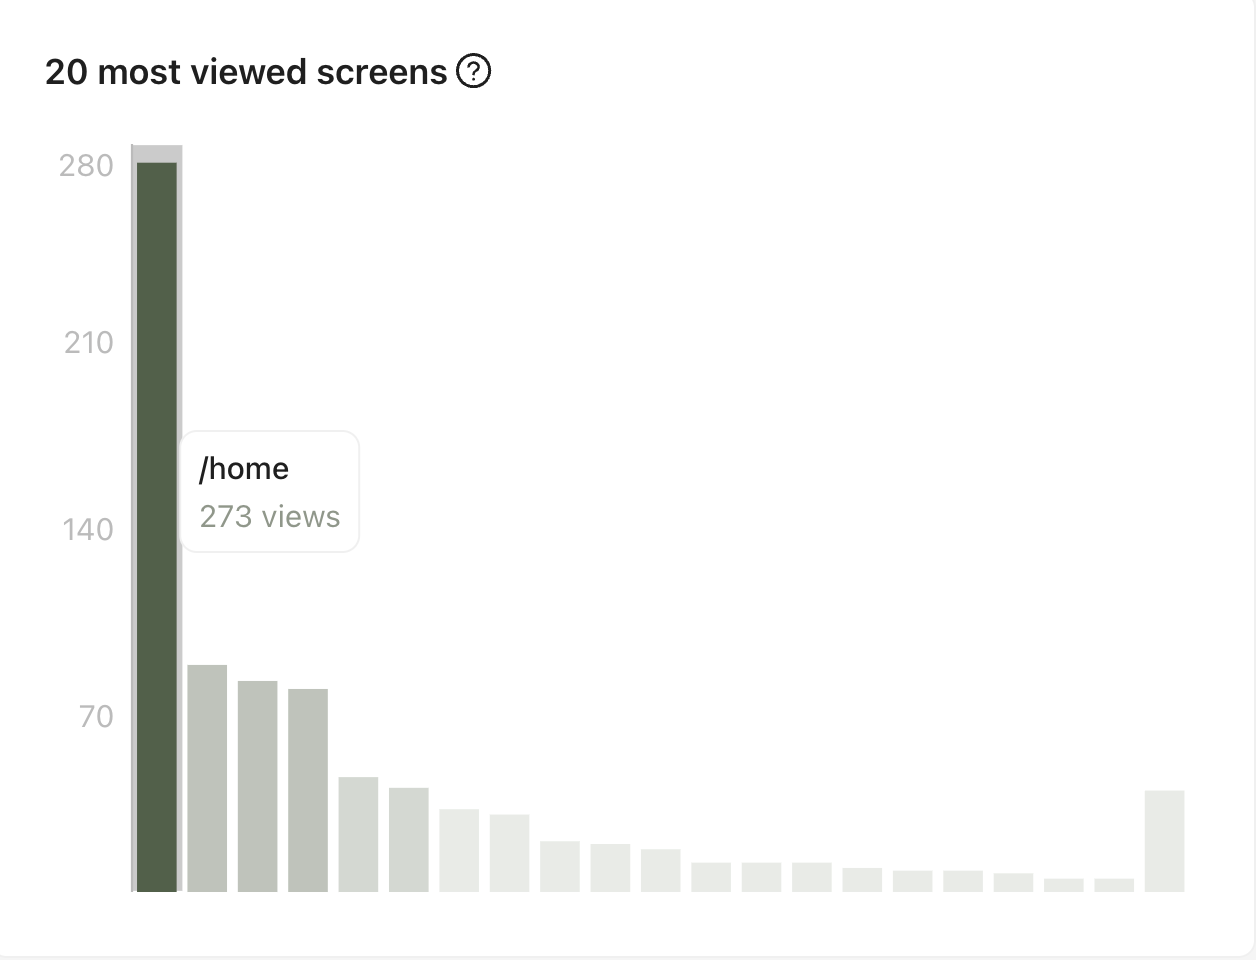
2.4. Top 20 most viewed screens: Top 20 most visited screens in the mobile application.
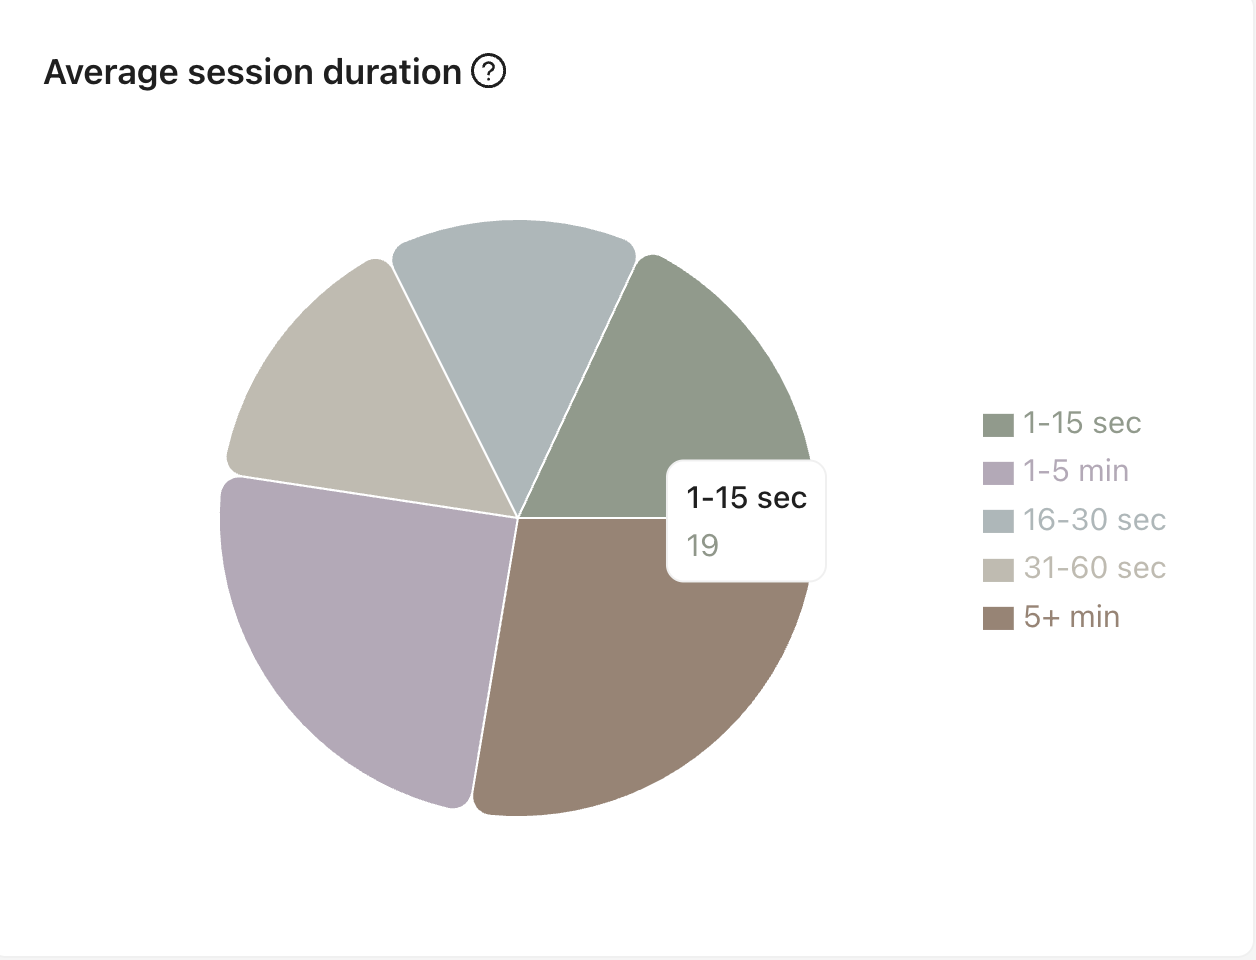
2.5. Average session duration: Time distribution showing how long users spend in the mobile app.
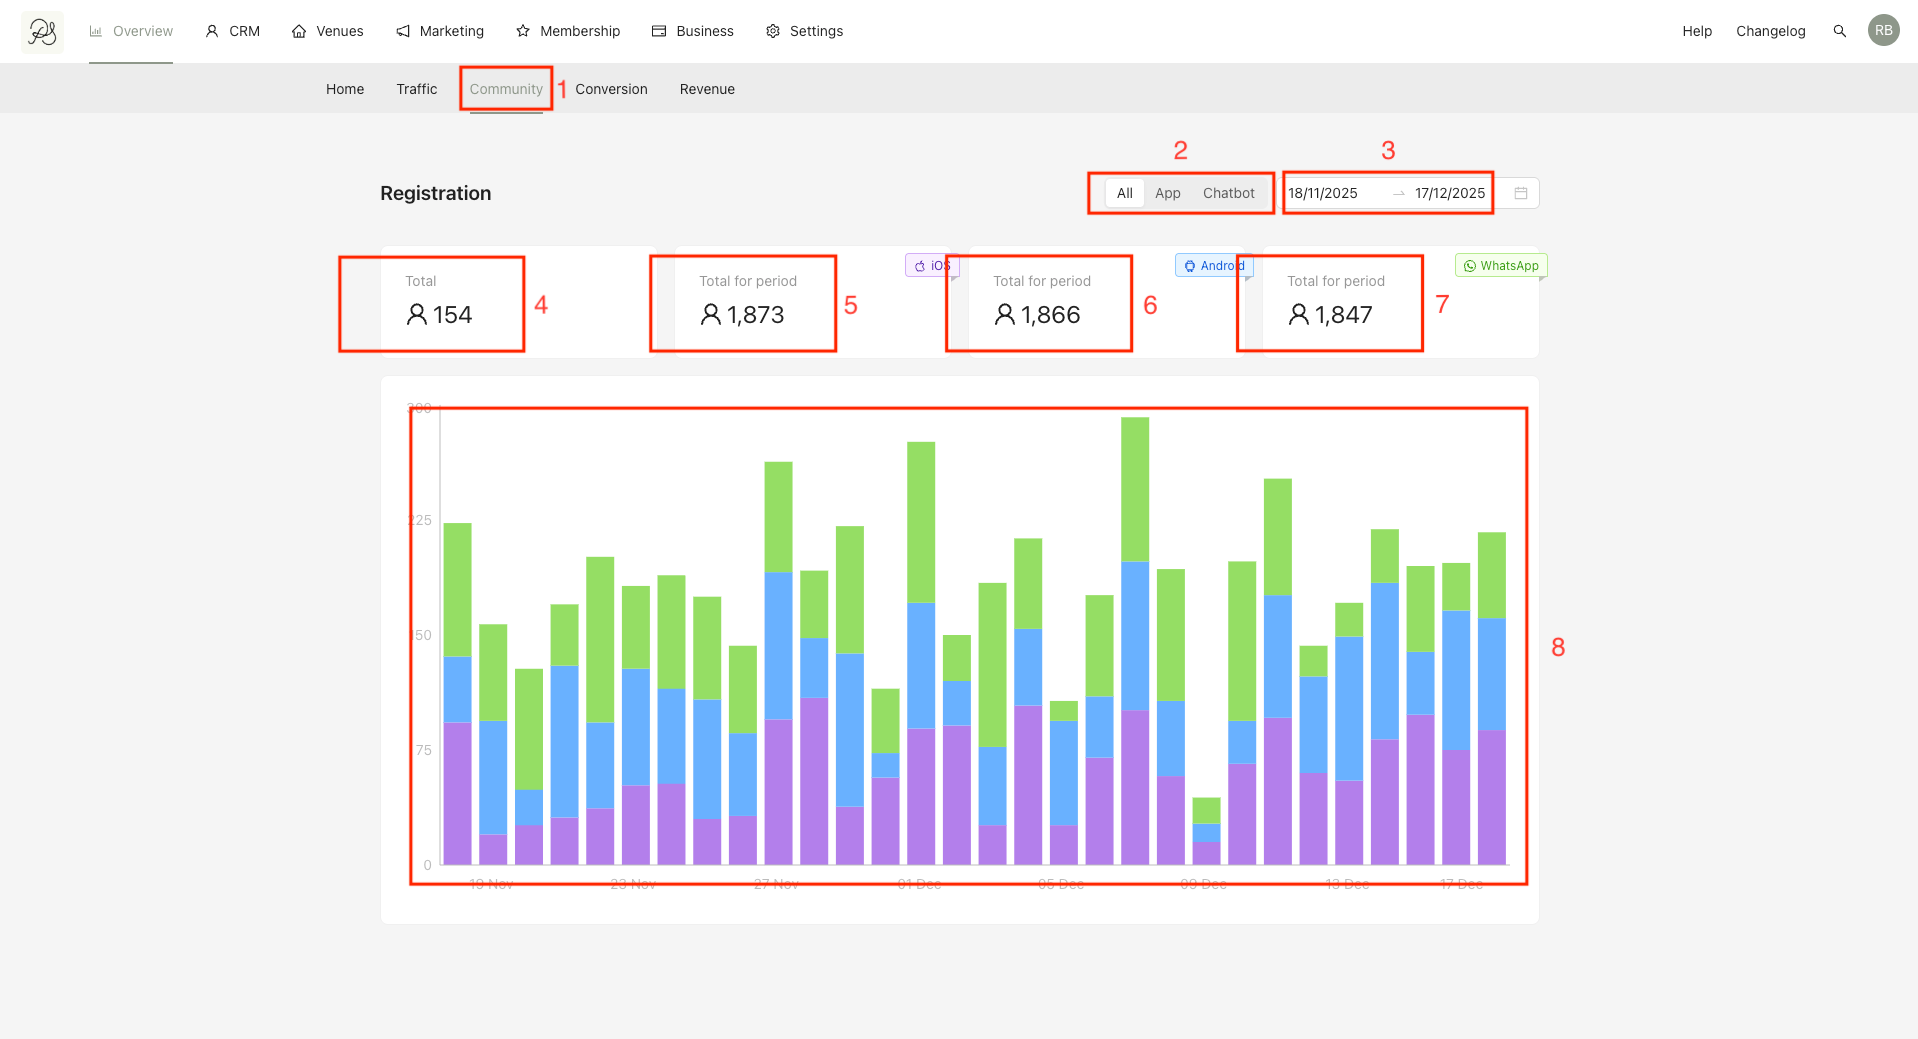
To access the page, click the tab Community (1) in the page Overview. You can see all the registration traffics of your users in all the channels. You can:
(2) You can select the product you want to analyze (App, Chatbot or All).
(3) Select the time range you want to view.
The traffics you can view:
(4) Total: Total number of new users during the selected period.
(5) Total for period - IOS: Number of new iOS users.
(6) Total for period - Android: Number of new Android users.
(7) Total for period - WhatsApp: Number of new WhatsApp users.
(8) Daily chart showing new users by platform: (Purple: iOS, Blue: Android, Green: WhatsApp)
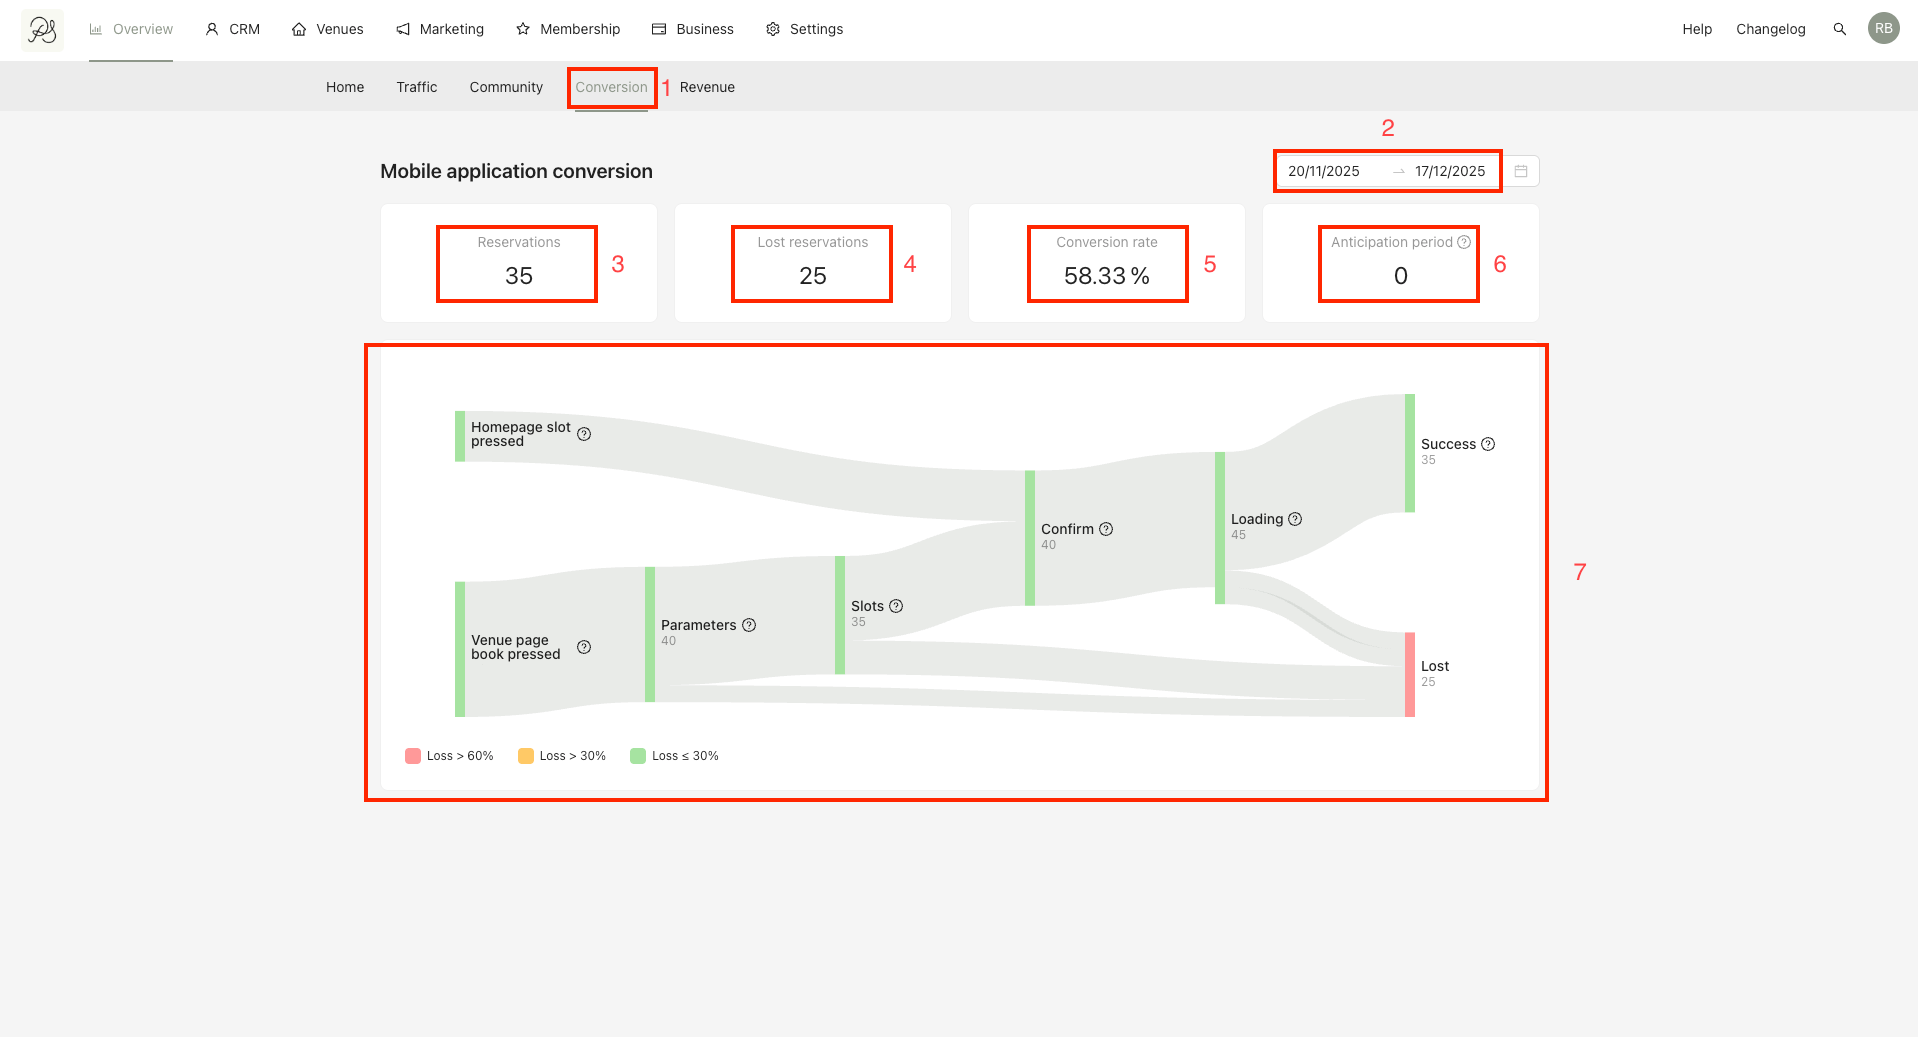
To access the page, click the tab Conversion (1) in the page Overview. You can see your mobile application conversion here. You can Select the time range (2) you want to view.
The metrics you can view:
(3) Reservations: Total number of reservations completed.
(4) Lost reservations: Number of users who abandoned a booking after selecting a slot or pressing Book.
(5) Conversion rate: Conversion rate after entering the booking flow.
(6) Anticipation period: Average time between booking creation and reservation date.
(7) Funnel chart showing user drop-off at each booking step.
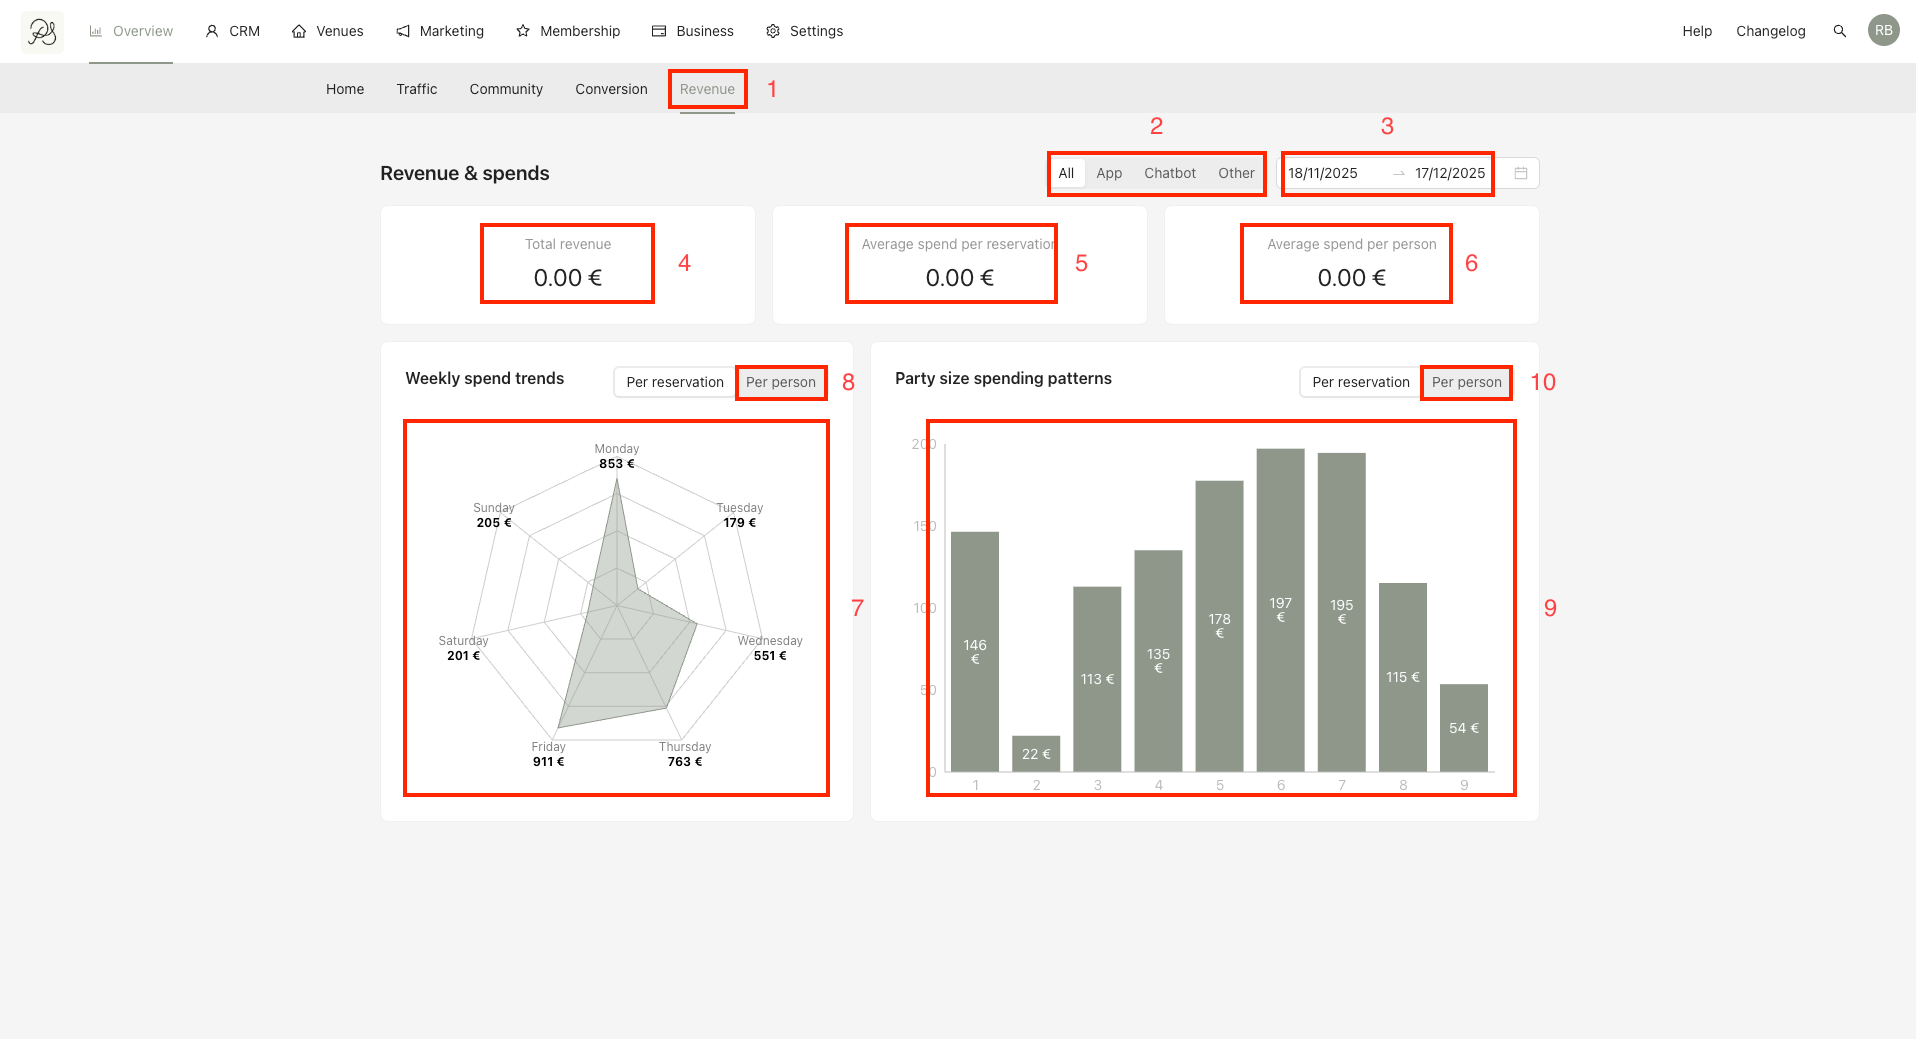
To access the page, click the tab Revenue (1) in the page Overview. You can see your mobile application conversion here. You can:
(2) You can select the product you want to analyze (App, Chatbot or All).
(3) Select the time range you want to view.
The metrics you can view:
(4) Total revenue: Total revenue generated.
(5) Average spend per reservation: Average revenue you receive per reservation.
(6) Average revenue per person: Average revenue you receive per person.
(7) Weekly spend trends: Chart showing the average amount spent per reservation for each day of the week. You can select Per person or per reservation to display (8) the data calculated.
(9) Party siwe spending patterns: Chart showing the average amount spent per reservation size (number of guests). You can select Per person or per reservation to display (10) the data calculated.